Skip to demo
Tic tac toe is a classic game, but the standard version is pointless. It’s far too easy to develop strategies that guarantee you’ll draw or win. You can make the game more interesting by increasing the board size from $3\times 3$ to $4\times 4$, but even that becomes too simple after a while. To develop a truly intriguing alternative version, you need to move on to higher dimensions.
3D Tic Tac Toe Board
Tic tac toe is a two-dimensional game because you play it on a piece of paper. A line of $x$’s or $o$’s on the paper is a win. In three dimensions, you’re still trying to form lines, but there are significantly more ways to win because you’re playing in a cube and not on a flat sheet.
If you’re having trouble visualizing this, take out a $3\times 3\times 3$ Rubik’s cube. Instead of writing $x$’s and $o$’s with a pen, you’re putting an $x$ or an $o$ inside of a Rubik’s cube piece – either a center, an edge, or a corner. Three-dimensional tic tac toe has one additonal spot, though: the very middle of the cube, hidden from the outside.
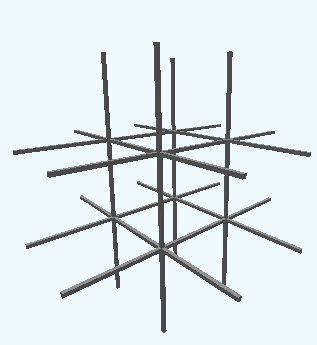
Figure 1: A $3\times 3\times 3$ cube with $27$ cells. This is the “board” you would play 3D tic tac toe on.
There are a whole bunch of different ways to win in this version. You could look at each slice of the cube as a standard $3\times 3$ board and win in the normal ways, or you could form lines that span multiple slices. For instance, three in a row down the central column, or three in a row from corner to corner through the middle.
Playing on Paper
If you want to play in three dimensions on a sheet of paper, all you need to do is draw three standard tic tac toe boards on top of one another. Each board represents a layer of the cube, and the winning lines are the same. Players take turns writing in $x$’s and $o$’s in the squares just like in the normal version of the game.
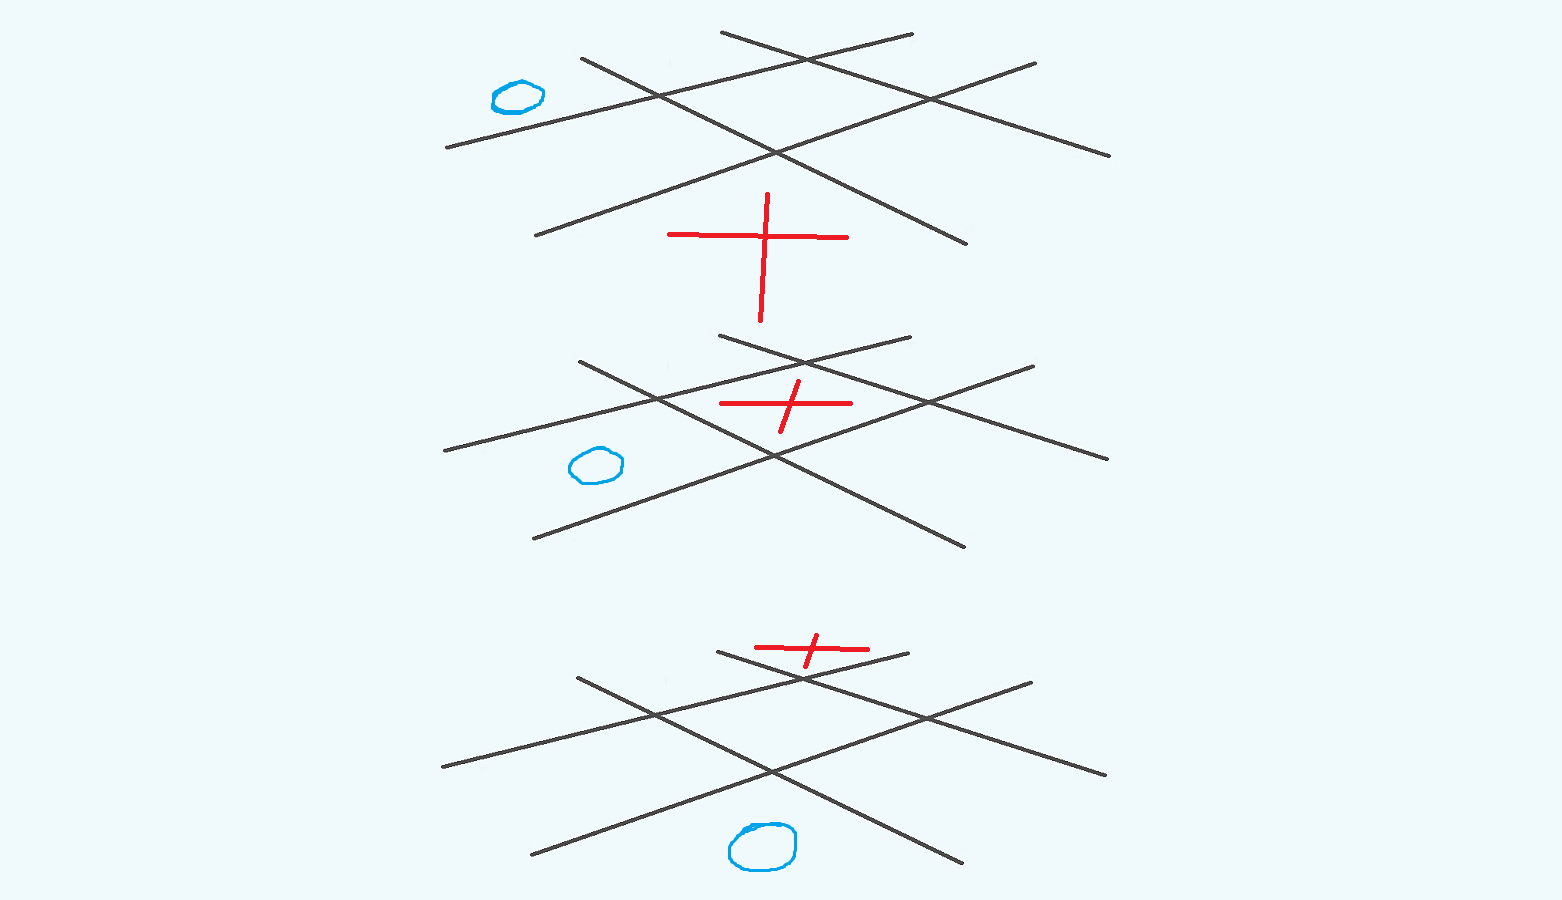
Figure 2: Three two-dimensional tic tac toe boards with two examples of winning lines.
Please have a clear sense of why the above two lines are winning arrangements. It’s going to get a lot more confusing later on…
Mental Tic Tac Toe
Playing on paper is perfectly fine, but I recommend trying to play in your head with a friend! Yup, with your eyes closed, visualizing the tic tac toe cube in your mind. This isn’t too strange of an idea. After all, some people can play chess in their heads, and chess is a lot more complicated. To play blindfold chess, participants take turns stating their moves in an agreed upon format (like algebraic chess notation)). “Blindfold” 3D tic tac toe works in the same way.
Whereas in chess there are a bunch of different piece types, in tic tac toe, all that matters is the location of an $x$ or an $o$. You could assign each three-dimensional grid space a letter of the alphabet so long as you and your friend are consistent, but the most general, extensible method is to use coordinates.
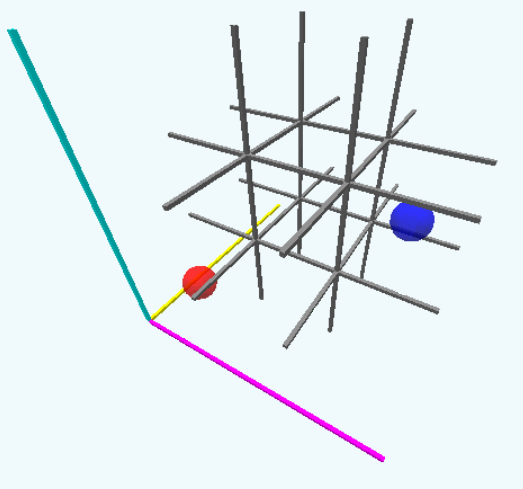
Figure 3: A 3D tic tac toe board next to a set of axes.
In the above image, there’s a yellow axis, a cyan axis, and a magenta axis ($\color{goldenrod} x$, $\color{turquoise} y$, and $\color{magenta} z$ respectively). The axes intersect at $(\color{goldenrod} 0,\color{turquoise} 0,\color{magenta} 0)$, which is the location of the bottom-left-most grid space and the red sphere. Each grid space is $1$ unit further away, so for a $3\times 3\times 3$ cube, the coordinates range from $0$ to $2$. Take a moment to determine the coordinates of the blue sphere under this system. It’s $(\color{goldenrod} 1,\color{turquoise} 1,\color{magenta} 2)$.
To play, take turns stating coordinates with another person. Keep track of all of the coordinates that have been said so far, imagining the cube and the pieces within it in your head. With a bit of practice, playing mentally becomes a piece of cake. It’s a great way to improve your spatial reasoning and visualization skills, and it’ll enable you play 3D tic tac toe wherever you are.
Playing in Four Dimensions
Okay. Now for the fun part! We’re going to add yet another dimension! Four-dimensional tic tac toe. I feel like another t– word is in order. Tic tac toe toc maybe? One per dimension?
It’s essential at this point that you are totally comfortable with tic tac toe in three dimensions, including playing it mentally. For the 3D version, I explained the game visually with figure 1 before explaining how to play it in your head. For four dimensions however, it’s best to start with the mental version because at this point we’re really stretching the capabilities of our 2D computer screens. If you’re already comfortable thinking in 4D, skip to the game. Otherwise, read on.
Figures 1 and 3 may appear clearly three-dimensional, but they’re just flat projections. We perceive 3D objects through 2D mediums all the time (literally all the time; our eyes can’t see 3D), so we don’t have a problem doing this, but projecting four dimensions down to two is a huge challenge.
Meaning of dimension
A spatial dimension is a line you can move along. Think: left and right, front and back. Multiple lines means multiple dimensions, but only if those lines are mutually perpendicular. A piece of paper is two-dimensional because if you only have one line, there are regions of the paper you’ll never be able to reach. Adding a second line perpendicular to the first gives you the freedom to move not just left and right but also up and down. Two lines encompass the entire sheet. Two dimensions.
But two lines aren’t enough to move around a cube; we would always be stuck on the bottom layer. We need a third line, bringing us to three dimensions total. If we wanted to state the location of a point in this cube, we would need to say how far we moved along each line. Three lines, three coordinates, three dimensions.
Extending this idea to four dimensions would be easy if not for the requirement that these lines be mutually perpendicular. In fact, it’s impossible for four lines to be mutually perpendicular in three dimensions. So in your head, do not try and visualize a fourth axis! Instead, focus on the idea of movement.
Visualizing the Fourth Dimension
When we move along a single dimension, our position in every other dimension remains constant. If you move left or right on a sheet of paper, you don’t change how far up or down you are, for instance. So when we move through the fourth dimension, we actually stay right where we are in the first three.
Let’s pretend I’m a four-dimensional creature and you’re your normal 3D self. You’re in your room, which remains constant in the fourth dimension. I proceed to hover a glowing, 3D green cube right in front of your face, and I place a red cube in the same spot further along in the fourth dimension. Remember: you’re 3D, so you can’t see the red cube.
At this point, I use my alien tendrils to give you a nudge in the fourth dimension. Suddenly, the green cube pops out of existence. There’s no warning – no smooth fade to nothingness and no shrinkage. It just disappears. Why? Because it was 3D and its coordinates took the form $(x_g, y_g, z_g, w_g)$, where $_g$ signifies that these coordinates are for the green cube. Initially, your position in the fourth dimension – the $w$ dimension – matched that of the cube, so you could see it. But the second my slimy alien fingers gave you that push, you moved through the fourth dimension to $w_g+\Delta w$. Your 3D coordinates are exactly the same, but since your $w$ coordinate changed, the cube is no longer in your line of sight. You’re 3D.
Eventually, you drift to $w_r$, where I stop you. Now, there’s a red cube in front of you, and it popped into existence out of nowhere. At no point in this journey did you leave your room. All that appeared to change was the color of the cube in front of you. Imagine me pushing you back and forth between the two; your body feels the acceleration of my push, and you alternatingly see the green and red cubes.
Those cubes were 3D, which means they only existed in particular slices of the fourth dimension, just as a sheet of paper appears to have no depth in three dimensions. But now I’m going to use my alien tehnology to generate a 4D cube, a tesseract, in front of you. What color tesseract? An infinitely colored, rainbow one! Sort of like this:
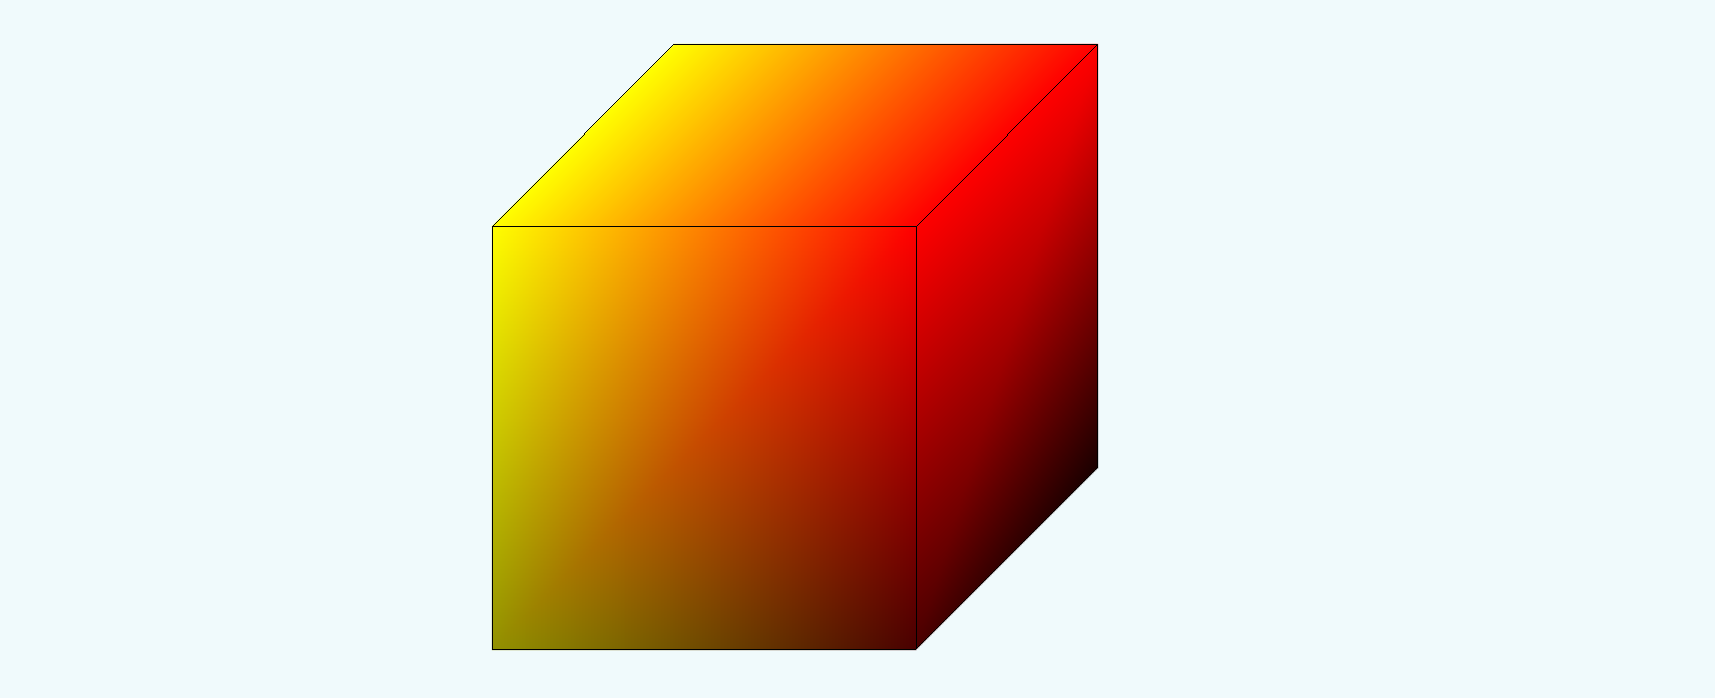
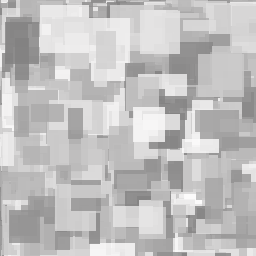
Figure 4: A cube that transitions from yellow to red smoothly left to right.
This cube’s color depends on where you’re looking along the left-right axis. The far left is yellow, and the far right is red. Pretend this were a stack of post it notes. The first note is bright yellow and the note at the very bottom is red. Imagine flipping through the notes; each individual post it is a solid color, but flipping through them quickly yields a smooth gradient.
You’re back in your room, still your 3D self, but this time you’re faced with a red cube initially. If I didn’t already tell you this were a tesseract, you would have no idea there was something special about this cube. That is, until the 4D push.
Since this cube does exist in four dimensions, it doesn’t disappear when your $w$ coordinate changes. The cube stays in precisely the same spot as you move along the $w$ axis, but it changes color, first red, then orange, then yellow and green and blue and violet. I did say it was a rainbow tesseract, after all.
Think back to the post it note example. We flipped through two-dimensional slices – pieces of paper – along the third dimension and saw a smooth transition from yellow to red. This time, we’re moving along the fourth dimension and seeing a 3D object change color. It’s important that you’re making an effort to see this in your mind’s eye and not just reading.
I continue pushing you, but once you pass blue and violet, the cube disappears. What happened? This was a finite tesseract, so it’s possible to move beyond it in the fourth dimension. At that point, it would be behind you and thus not visible. If I pushed you in the other direction, you would see violet, blue, … , orange, red and then nothing. The tesseract would be “in front” of you in the fourth dimension and again, not visible. Normally, you can see things that are in front of you, but you can’t see “forward” in the $w$ direction with your normal, human eyes. Therefore, the cube blips out into the unknown.
And now for the final step! Using advanced alien technology, I upload your consciousness into a four-dimensional body complete with eyes that can see along $x$, $y$, $z$, and $w$. Let’s examine how this changes your perception of the green-red example.
Consider what’s it’s like to look at objects along a dimension. If you had a dozen identical cars lined up along a straight road, the cars that were further away would appear smaller than the cars right in front of you.
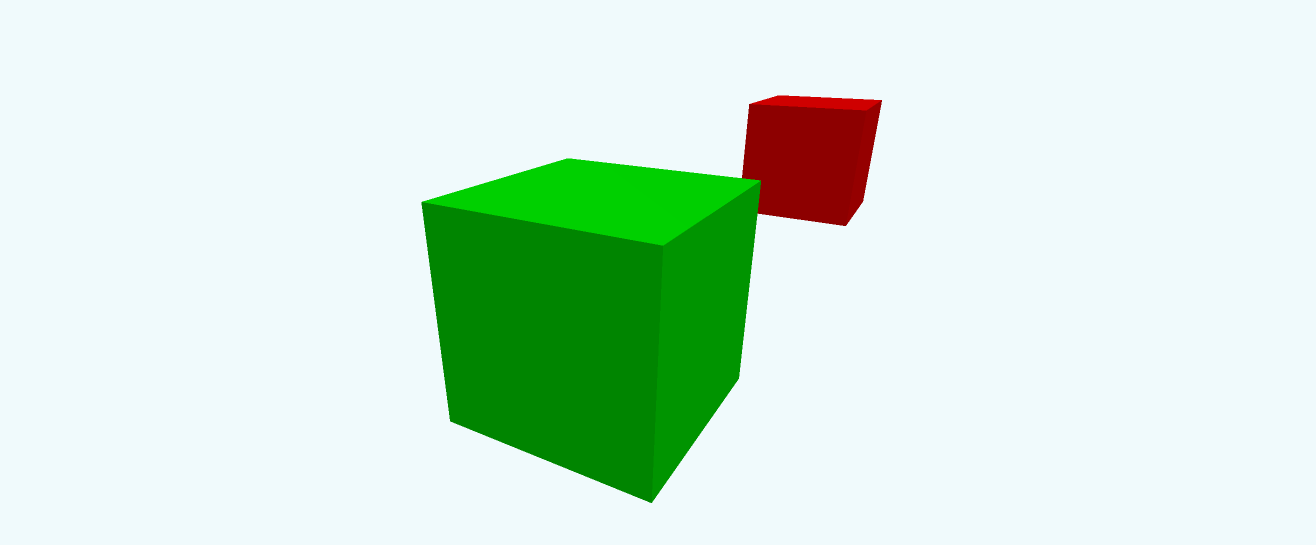
Figure 5: A large green cube and small red cube demonstrating perspective.
Here’s the glowing green and red cubes I placed in front of you earlier, but this time, there isn’t any four-dimensional monkey business. There are just two cubes, one near and one far. Internalize the fact that the further away an object is, the smaller it appears.
If you’re next to a race car just as it’s about it zoom straight ahead, away from you, it would begin large and then get smaller and smaller as it moved down the track.
Now consider a race car traveling along a hundred mile straight track in the $w$ dimension. It’s only moving along the fourth dimension, so its 3D position shouldn’t change. Even though it’ll zoom away from you, its wheels will always be right in front of your feet.
What then do you see? Well, we know that the farther away an object is, the smaller it appears, and it doesn’t matter if I’m a hundred miles in front of you, a hundred miles above you, or a hundred miles away along $w$; regardless of the direction, far is far. So as this special race car zooms onwards, it will appear to shrink right in front of your eyes. Imagine that!
Back to the cube example. You’re in your room. In front of you is a glowing green cube, and in the same exact 3D spot further in the fourth dimension is a red cube. What do you see with your new 4D eyes? Seriously, try and figure it out.
You see a small red cube inside of a large green cube. The red cube is further away after all, so the rules of perspective say it should appear smaller.

Figure 6: A representation of perspective along a fourth dimension.
The cubes aren’t actually transparent, but just as humans’ 3D eyes enable them to see 2D surfaces, our alien 4D eyes let us see in legitimate 3D. That is to say, we can see inside of solid 3D objects. We can see the 3D red cube inside the 3D green cube even though they’re both opaque.
“Tic Tac Toe Toc” in Your Head
You are now armed with the necessary intuition to extend tic tac toe into 4D. First, picture an empty 3D grid as you normally would. Then, picture another in the exact same spot, just slightly smaller. Finally, imagine one more, even smaller. Can you do it? (Why did we stop at three grids? Think for a moment if you don’t already know.)
If you can visualize that, mad props, but for me, that’s just way too crowded. We haven’t even placed any pieces yet! Instead, I recommend playing mental 4D in the same way that we played on-paper 3D. We stacked three ordinary two-dimensional grids and just thought extra hard about how the different slices related to one another. For 4D, picture three 3D grids side by side, left to right. Isn’t that so much easier?
As far as coordinates go, you just need to make one minor change. Add a $\color{yellowgreen} w$ coordinate that designates which of the three 3D grids each piece goes into. Let $\color{yellowgreen} {w=0}$ signify the leftmost grid and $\color{yellowgreen} {w=2}$ the rightmost.
You now know how to plot 4D coordinates in a modified 4D grid, and you know what that grid would actually look like in four dimensions. The final step is learning to identify winning lines in 4D. As we saw with 2D → 3D, all the lower dimensional winning lines remain, but we have a bunch of extra options available to us. I’m only going to explain lines that extend across the fourth dimension, which means there will be one piece per 3D grid (per “slice”).
The top-left-front corner of each slice, corresponding to $(\color{goldenrod} 0,\color{turquoise} 2,\color{magenta} 0,\color{yellowgreen} 0)$, $(\color{goldenrod} 0,\color{turquoise} 2,\color{magenta} 0,\color{yellowgreen} 1)$, and $(\color{goldenrod} 0,\color{turquoise} 2,\color{magenta} 0,\color{yellowgreen} 2)$? That’s a winning line. It’s difficult, but visualize these pieces in 4D perspective. The larger the $w$ coordinate, the smaller the piece would be and the closer it would be to the center. They would form a literal line of pieces in the top-left-front-ish corner. The line would point to the exact center of the 4D grid.
What about $(\color{goldenrod} 0,\color{turquoise} 1,\color{magenta} 2,\color{yellowgreen} 0)$, $(\color{goldenrod} 1,\color{turquoise} 1,\color{magenta} 1,\color{yellowgreen} 1)$, and $(\color{goldenrod} 2,\color{turquoise} 1,\color{magenta} 0,\color{yellowgreen} 2)$? Take as much time as you need to plot each of these coordinates in the modified 4D grid. Then try and view it in 4D perspective. It’s also a winning combination.
And now for the coolest way to win, one of the many long diagonals: $(\color{goldenrod} 2,\color{turquoise} 0,\color{magenta} 2,\color{yellowgreen} 0)$, $(\color{goldenrod} 1,\color{turquoise} 1,\color{magenta} 1,\color{yellowgreen} 1)$, and $(\color{goldenrod} 0,\color{turquoise} 2,\color{magenta} 0,\color{yellowgreen} 2)$. Make sure you see the line before moving on.
Try the Game
The game below requires WebGL. If it doesn’t work, upgrade to a modern browser like Chrome. Left click and drag to rotate. Scroll to zoom in and out. To move around, right click and drag or ←↑→↓. Enter piece coordinates in the color-coded form below.
Problem with 3D+
Unfortunately, there’s a strategy that allows the player who goes first to guarantee a win in $3\times 3\times 3$. I’m not going to tell you what it is because I had fun figuring it out, but you should know that if you want to have fair 3D and 4D games with your friends, you need to prohibit $(1,1,1)$ in 3D and and $(1,1,1,w)$, $(x,1,1,1)$, $(1,y,1,1)$, and $(1,1,z,1)$ in 4D on the first move.
Alternatively (this is what I did with my friends), you can increase the size of the grid and graduate to $4\times 4\times 4$ and $4\times 4\times 4\times 4$ games. If you’ve followed along this far, you should have no problem figuring out what that entails.
Number of Ways to Win
When I first started playing 3D tic tac toe, the first thing I wondered was how many ways there were to win. There are $8$ ways to win in normal tic tac toe, and counting those ways is straightforward. But in three dimensions, counting is a whole lot harder.
Where $D$ is the number of dimensions and $S$ is the size of the grid, $2$ and $3$ in standard tic tac toe respectively, the following table summarizes the number of winning arrangements:
| D=2 | D=3 | D=4 | D=5 |
|---|
S=2 | 6 | 28 | 120 | 496 |
|---|
S=3 | 8 | 49 | 272 | 1441 |
|---|
S=4 | 10 | 76 | 520 | 3376 |
|---|
S=5 | 12 | 109 | 888 | 6841 |
|---|
There are more than $30$ times the number of ways to win in four-dimensional $3\times 3\times 3\times 3$ than there are in ordinary tic tac toe. As someone who has played many 4D games, believe me when I say that this difference is what makes 4D so interesting. You’re always on the lookout for sneaky lines, and there are far too many to just scan the grid procedurally. (Note: lots of math up ahead)
In order to count the total number of ways to win, we need to look at the various types of winning lines. In normal tic tac toe, I claim that there are just two: 1) diagonals and 2) horizontals and verticals. Yes, horizontal and verical lines are in the same category. Do you see the distinction? Draw a picture and try to figure out the key difference.
Hint: it has to do with dimensionality.
Lines are one-dimensional by definition, but they can span more than one dimension if they’re rotated relative to the coordinate system. Horizontal tic tac toe lines only take up space in one dimension, the left-right dimension (up-down for vertical lines). Diagonal lines in contrast move both left-right and up-down.
Continuing along this train of thought, consider 3D tic tac toe. Are there other types of winning lines? We have our horizontal, vertical, and in-your-face lines. They span just one dimension. And then we have the diagonal lines across slices of our cube. The fact that they exist on a slice means they don’t move in the direction in which the slice is skinny.
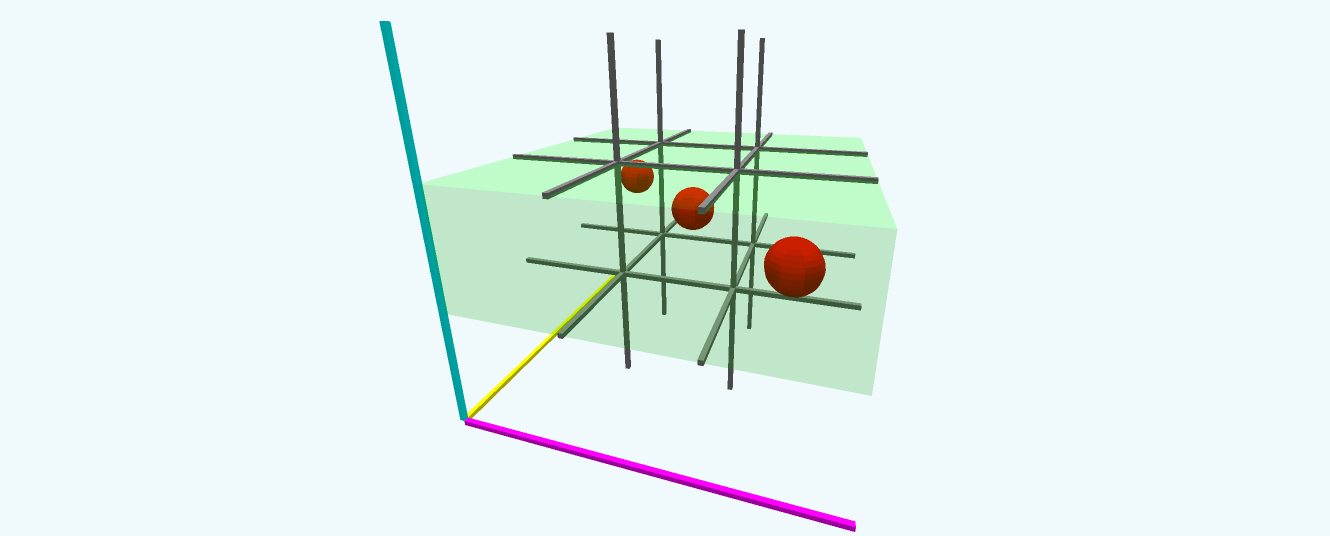
Figure 7: This visual highlights the middle slice of a 3D grid, which contains a short diagonal line.
Take any $3\times 3$ slice and draw its two diagonals; they span two dimensions.

Figure 8: The long diagonal of a 3 by 3 by 3 grid.
Lastly, there are the long diagonals, from corner to opposite corner, which span all three dimensions. Three dimensions, three types of winning lines.
More generally, for tic tac toe in $n$ dimensions, there are $n$ different types of lines which correspond to lines spanning dimensions $1$ to $n$. If we can count each of these types, then we’ll be finished.
The easiest line to count is the long diagonal, the line that spans all $n$ dimensions. There are two such lines in $3\times 3$ tic tac toe and four in $3\times 3\times 3$. Long diagonals begin at a corner, so we have an upper bound of the total number of corners. For a cube in $n$ dimensions, the number of corners is $2^n$. Since long diagonals also end at a corner, we’re counting each of them twice. Thus, the total number of long-diagonals for an $n$-hypercube is $\frac{1}{2}2^n$.
Luckily for us, all line types are instances of long diagonals. I called the line in Figure 7 a short diagonal because there were longer ones, but within its 2D slice, it’s a long diagonal. Even horizontal and vertical lines are diagonals, just in one dimension instead of two or three.
If we can count the number of 2D slices in a 3D cube, multiplying by $\frac{1}{2}2^2$ will give the number of lines that span two dimensions. Similarly, we need to count the number of 1D “slivers”. So far, we’ve focused on the dimensions in which a line changes, labeling lines as spanning either 1D, 2D, or 3D depending on how many dimensions it moves in. However, for the purposes of counting, I think it’s easier to look at the dimensions in which a line doesn’t move. A 1D line doesn’t move in two of the three dimensions, and a 3D long diagonal moves in all of them. For a 1D line, two dimensions are the same for all of its constituent points.
This brings us to a key question: in how many ways can two dimensions be the same? For a 3D cube, answering this question will give us the number of 1D slivers.
Various pairs of dimensions can be the same: $\langle x,y\rangle$, $\langle x,z\rangle$, and $\langle y,z\rangle$. Each of these dimensions can take on values from $0$ to $S-1$, where $S$ is the side length, so there are $S^2$ slivers for each of the three pairings. This yields $27$ one-dimensional slivers for a 3D cube. Since the number of long diagonals in one dimension is $\frac{1}{2}2^1=1$, there are $27$ horizontal, vertical, and in-your-face lines for $3\times 3\times 3$.
Let’s go back and examine the number of 2D slices in a 3D cube. We now know this is equivalent to finding the number of ways that one dimension can be the same. That constant dimension can be $\langle x\rangle$, $\langle y\rangle$, or $\langle z\rangle$, each of which can take on $S=3$ different values, giving us $9$ slices total. There are $\frac{1}{2}2^2=2$ long diagonals per slice, giving us $18$ “two-dimensional” lines in a $3\times 3\times 3$ cube.
Since there’s just one way for zero dimensions to be the same, there are $\frac{1}{2}2^3=4$ “three-dimensional” lines in a $3\times 3\times 3$. Summing these values gives $27+18+4=49$ ways to win in three-dimensional tic tac toe ($S=3$).
For a general solution, we need an expression that gives the number of ways in which $C$ dimensions can be the same for a $D$-dimensional hypercube of side length $S$. First, we count the number of unique ways there are to choose $C$ dimensions out of $D$. That’s just ${D \choose C}$. Then, since each of those $C$ dimensions can take $S$ possible values, we multiply by $S^C$ to get ${D \choose C}S^C$.
Since $C$ dimensions are the same, $D-C$ dimensions can vary. The number of long diagonals in this space is $\frac{1}{2}2^{D-C}$. Multiplying these two expressions tells us that when you hold $C$ dimensions constant, you can create $\frac{1}{2}{D \choose C} 2^{D-C} S^C$ lines.
Anywhere from $C=0$ to $C=D-1$ dimensions can be constant, so to get our final answer we just need to sum up all those possibilities. The total number of ways to win in $D$-dimensional tic tac toe (side length $S$) is:
$$\frac{1}{2}\sum\limits_{C=0}^{D-1} {D \choose C} 2^{D-C} S^C\tag{1}$$
Algorithm for Detecting Winning Lines
Motivation
If you’ve ever implemented $3\times 3$ tic tac toe, you know about that annoying moment when you have to decide how you’re going to detect winning moves. Since there are only eight ways to win, writing an if statement for each possibility is easy and pain free. But it’s also ugly and terribly inelegant. You could be a little more clever and write two loops, one for the vertical lines and one for the horizontals, checking diagonals separately, but that would be more work for little benefit. Heck, it’d probably take more lines of code.
In three-dimensional tic tac toe there are $49$ cases to consider ($S=3$). Yeaahhh. Clearly, you can’t hardcode each individual configuration in an if like you could with $3\times 3$. Perhaps you could store winning lines in a condensed format, like [3,14,25] where each number corresponds to a cell in the grid, but that would be tedious and again, inelegant. And what if you wanted to expand your game to support $4\times 4\times 4$? Abstracting out the idea of slices and writing a series of loops would probably be best. Unlike $3\times 3$, there’s enough repetition in 3D tic tac toe to warrant looping over the different types of lines.
Do you see where I’m going with this? For four-dimensional tic tac toe ($S=3$), you would need to check $272$ cases. There is no way you’re listing all those lines out. As far as scaling back and looking at the grid’s constituent layers and 3D slices goes, it’s a lot harder to program something you can’t visualize.
It’s easy to check for lines on the six faces of a cube (and the middle slices) because we can see them, but the analogy in four dimensions is that there are eight “surface” cubes on a tesseract. Finding those faces and looping over them is incredibly confusing. And don’t forget, you still have your 2D layers and 1D slivers like you did before! When you can’t point to the geometry you’re working with, it’s hard to reason about what your algorithm should even be checking for.
Solution
I spent a lot of time thinking about this problem back when I started playing 4D tic tac toe, and I knew that I wanted to find an algorithm that generalized to any size hypercube in any number of dimensions. The solution is based off the method we used to count the number of ways to win. That is to say, given the game grid as a whole, we pick and choose dimensions to hold constant in order to reduce the problem to a lower dimensional space.
Before I explain the algorithm, I need to explain the data structure I chose to store the game state. It’s a $D$-dimensional array whose elements correspond to grid spaces and are either $-1$, meaning empty, $0$, meaning player 1 has a piece there, or $1$, meaning player 2 has a piece there. For two-dimensional tic tac toe, it’s just an everyday two-dimensional array. However, setting $D=4$ makes it an array of an array of an array of an array. I wrote a special function to access elements of this high-dimensional array given an array of coordinates.
There are two key ideas we discovered when we found the formula for the number of ways to win. The first idea is that all winning lines vary in at least one dimension. The second idea is that some dimensions may have the exact same coordinate value for all of the points in a winning line. For example, one of the four-dimensional winning lines we examined earlier:
$$\text{P}_1(\color{goldenrod} 0,\color{turquoise} {\underline 1},\color{magenta} 2,\color{yellowgreen} 0)$$
$$\text{P}_2(\color{goldenrod} 1,\color{turquoise} {\underline 1},\color{magenta} 1,\color{yellowgreen} 1)$$
$$\text{P}_3(\color{goldenrod} 2,\color{turquoise} {\underline 1},\color{magenta} 0,\color{yellowgreen} 2)$$
Notice how the $\color{turquoise} y$ coordinate is the same for all of the points. When we hold one dimension constant in three dimensions, we get a slice. When we hold one constant in four dimensions as we just did, we ought to get a 3D slice… but good luck visualizing where this cube fits. Good thing we don’t need to! Notice how every single other dimension is different in points $\text{P}_1$ to $\text{P}_3$. These points describe a long diagonal of a 3D slice of a tesseract. I’ll save you the trouble and just tell you that we’ll only ever need to check for long diagonals!
How do you check for those in $n$ dimensions? First, generate the coordinates of all the corners. Pair each up with its exact opposite (for corners, each coordinate is either $0$ or $S-1$; two corners oppose each other if none of their corresponding coordinates are the same). Then, move grid space by grid space from one corner to the other.
Now we can start to sketch out an algorithm. First, check all the long diagonals in $n$-space for lines. Then, pick a dimension to hold constant. Set it constant for each value from $0$ to $S-1$ and recurse on the now-smaller dimensional space. Do this for each of the $D$ dimensions.
That’s pretty much it. The base case is when $n=1$ since all you can do is iterate through the line. One way to implement this algorithm is to keep track of two arrays in each function call: one stores the dimensions that are allowed to vary and the other stores the values at which every other dimension is held constant. How freaking cool is it that we can write algorithms that can find lines we’ll likely never be able to see (in seven dimensions, for instance)?
Future Improvements
This algorithm as posed has its fair share of problems. For starters, it needlessly checks some lines more than once. By far the biggest issue though is that it checks every possible spot a line could be in, even if there aren’t any pieces near that region of the hypercube. For three and four dimensions this really isn’t that big of a deal because there are so few grid spaces in the first place.
Consider that a typical high-dimensional game of tic tac toe will have a dozen to a couple dozen placed pieces. At most, there could be $27$ pieces in 3D and $81$ in 4D (S=3), so around $15\%$ to $30\%$ of the board would be filled. Now consider a five dimensional grid with $S=7$: there are $16807$ grid spaces, resulting in an expected $0.1\%$ fill rate. This algorithm would waste so much time on empty space.
Ideally, I’d write an algorithm that found lines between sets of points. Instead of checking the grid, I would check the pieces that have actually been placed. Regardless of the number of dimensions or size of hypercube, the number of player 1 points and player 2 points would be small, so I can’t imagine you’d need to do too much work. If any of you readers have implemented this, I’d be very interested in seeing your code.
Tic tac toe is great, higher dimensions are great, and math and computer science are great. I strongly encourage you to fork this project on Github and make something neat. All the rendering is taken care of; you can focus on your game ideas! Try making three-player 4D. Maybe that would nullify player 1’s advantage. Hmm. Or you could write an AI and have computers play each other! Anyway, this is my longest blog post yet by far so I oughta stop thinking out loud.
Fork me on GitHub