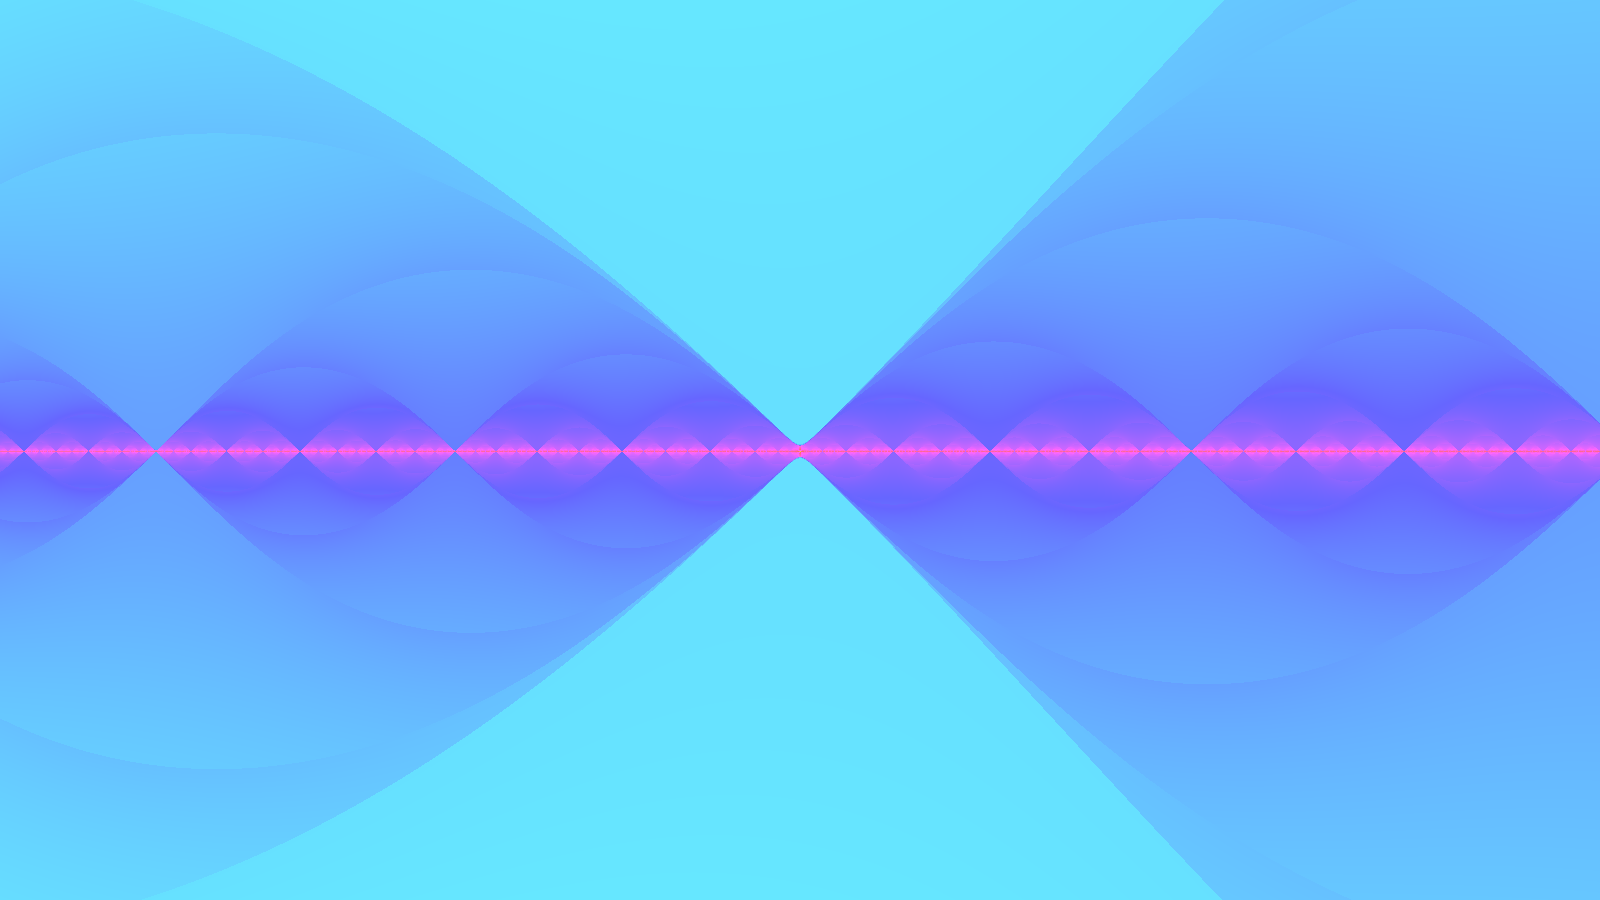
Random mathematical equations are used to draw pictures, which are then run through a cartesian genetic programmer (CGP) to generate increasingly attractive images.
Click your favorite picture. Avoid choosing the top left image whenever possible (when other images are exactly the same).
Using genetic programming, I wrote a program that can program better than I can. In Brainfuck, at least (note: Brainfuck is a programming language!).
Brainfuck is an incredibly confusing language that uses just 8 characters: +, -, >, <, ., ,, [, and ]. The language was made with this esoterism in mind, making it very difficult for humans to write programs in it. The natural question is: would a computer be similarly confused?
Traditionally, genetic programming has been applied strictly to languages that are hierarchical in nature and therefore conducive to crossover (a post explaining genetic programming is coming soon). For example, Lisp). But that’s been done a million times before. I wanted to see if GP could be applied to procedural languages. Would GP offer any benefit over randomly generated programs? And if so, would this benefit be significant enough to surpass my own ability to write Brainfuck?
The Plan
Genetic programming is a fancy, super cool, bio-inspired search algorithm. Ignoring all the analogies to real world evolution, it’s nothing more than a method of traversing some space of possible answers. For this problem, that answer space is the set of all possible Brainfuck programs. If we require that each program be $32$ characters long, then there are $8^{32}=7.9\times10^{28}$ potential answers because each character can be one of $8$ commands. Keep in mind that not all strings in this answer space are valid programs. Here are a few examples of $32$ character long programs that are: $$>,<+,[+[+.>>]].-<[-,<]+.+.–>..<$$ $$[+[.-.]<->,-]>[..++<-..-.]++>+,.$$ $$++<.[[-]..[>.]],.>,.–[<]<,.>..-$$ $$>+[++[..-.]>],-..->+.–.>..<,..+$$
Imagine a billion billion billion of those. Now imagine going through all billion billion billion of those and finding one that solves the problem at hand. Genetic programming doesn’t iterate through every possibility, but it still arrives at pretty good answers. It’s based on the idea that okay solutions are similar to good solutions which are similar to great solutions. GP relies on the fact that success builds up. This has been shown to be absolutely true for high level languages with clear, tree-like structures, but it isn’t immediately obvious that this property applies to Brainfuck.
Another method is to search randomly. This is superior to an organized, one after another approach because you don’t have to waste any time probing unsuccessful regions of the search space. As long as you keep track of the best program you’ve seen so far, you can take a comprehensive survey of the answer space with very little work. Keep in mind, search spaces are often tremendous, so this approach is unlikely to work well.
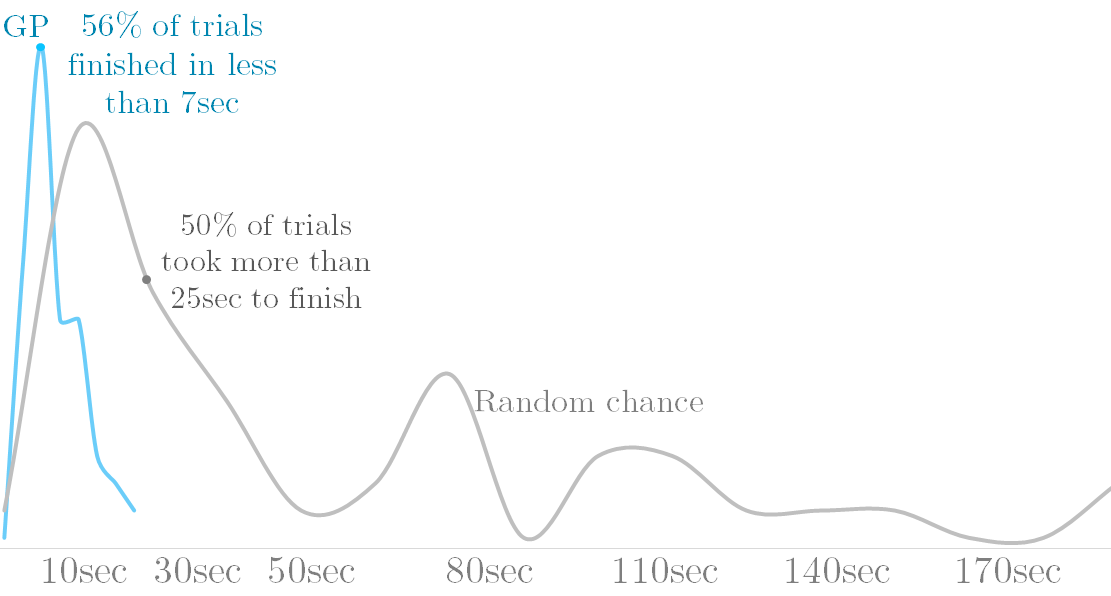
My hypothesis that genetic programming is better than chance (for Brainfuck) can be tested by comparing how long it takes each method to solve a certain problem. For simplicity’s sake, I chose the problem of symbolic regression, which is the process of finding an equation to model some data set. I tested how long it took randomly generated programs to model a simple set of points, and then I looked at how long it took genetic programming to converge on the solution to that same set of points.
Results
This table shows various measures of how long it took each method to solve a simple symbolic regression problem. The genetic programmer was run with a maximum program size of $32$ characters and a population size of $50$. Each method underwent $50$ trials. As these are all times, smaller numbers are better.
Method
Avg (s)
Min (s)
Max (s)
Std. Dev.
GP
7.653
2.015
20.536
4.317
Chance
44.765
0.970
179.37
46.877
Both methods solved the problem pretty quickly some of the time, but GP maxed out at around $20$ seconds while random chance took as long as $3$ minutes. Comparing their averages, GP performed $5.85$ times as quickly. The following is a smoothed histogram* displaying the percentage of trials that took a certain amount of time to run.
Genetic programming is the clear winner. *Note: the data was smoothed heavily, so area isn’t proportional to number of samples like it should be.
Brainfuck Language
At this point, I knew that using GP to write Brainfuck wasn’t a waste of time, so I began competing with it to answer my second question. Before explaining the test cases I chose, I’ll describe Brainfuck’s language features. There’s no formal specification of the language, so not all implementations define each of the eight commands in the same way. I’ll describe my interpreter, which is pretty standard.
Brainfuck is characterized by its ultra-simple method of keeping track of information. Each program begins with a couple hundred cells all filled with the value $0$. Programs can only focus on one cell at a time, moving between them with the > and < characters, right and left. The + character increments the current cell by one, and the - character decrements it. Cell values are capped at $255$, looping around to $0$ whenever they overflow.
Brainfuck also has input and output, with the , and . characters, respectively. My , character reads bytes from an input stream (one byte per ,) and loads them into the current cell. My . character adds the current cell’s value to an accumulator, which starts at $0$ and is returned when the program terminates.
Lastly, there are the [ and ] characters, which work together to enable loops. The Brainfuck code they sandwich is run again and again until the cell that’s in focus at the end of the loop is $0$. The program: $$++[>++<-]>.$$ increments the first cell to two and loops the following subroutine twice: add two to the cell to the right, move back left, and decrement. Then, it moves to the cell it was incrementing and outputs it. If this program were written in Javascript, it’d look something like:
lang-javascript
1
2
3
4
5
6
7
8
9
var cell_0 = 0, cell_1 = 0;
cell_0++;
cell_0++;
while (cell_0 !== 0) {
	cell_1++;
	cell_1++;
	cell_0--;
}
console.log(cell_1);
A simpler version would be “$++++.$”. There’s always the risk of infinite loops, so I opted for the simple solution of setting a time limit to the execution of a Brainfuck program.
Competition
I knew the limitations of my Brainfuck implementation, so I didn’t choose very glamorous test cases. I tested the genetic programmer on constant generation (outputting a constant number like $86$ for instance), on adding a constant to an input, on summing two inputs, and on multiplying two inputs. I was able to write Brainfuck programs that did all these things pretty easily, and so was the genetic programmer. Then I tried division by two.
I gave myself a half hour to solve the problem, but I wasn’t able to come up with a Brainfuck program that did what I wanted! The best I was able to do was “$,[>+.-<–]$”, which works for even numbers only. The genetic programmer, however, was able to do it: $$,[-[->+>.<.>]<-<].+$$ I still don’t understand how its division algorithm works. I’ve implemented the algorithm in Javascript and followed its execution, but I still lack a clear understanding of why it works.
Hmm, I thought. If only I could recognize even and odd numbers, then I could write programs for each of the two separate cases and combine them. So began the next challenge, finding the remainder of a number when divided by two. I wasn’t able to solve this problem either (only solved it for even numbers). But of course the genetic programmer was: $$,[-<+.>[–][>->.,[-]<<]],$$ In eleven minutes, even (pun intended)! Something that amazes me about this specific program is that it purposely puts itself in an infinite loop for even numbers, because when I first evolved this program, my interpreter output $0$ if programs took more than a few milliseconds to run. $0$ just so happens to be the correct answer for even numbers, so it works! Evolution cares about one thing and one thing only: practicality. The genetic programmer found a niche, timing out to force a $0$ output, and it exploited it perfectly to solve the problem at hand.
Brainfuck Interpreter
Here’s an interpreter for my flavor of Brainfuck. It only supports integer outputs so you can’t work with characters, but you’d literally have to modify less than five lines of code if you wanted ASCII output. All you’d need to do is change the behavior of the . command. Fork this project on github.
The , character loads the leftmost unseen input into the current cell. Inputs must be integers in the range $[0,256)$.
Output: N/A
Try copy pasting the divide-by-two program, loading the dividend in the first input section. Then play around with the program’s source to see which characters are essential and which aren’t. The programs work, but by no means are they optimal.
Next Steps
I initially wrote the genetic algorithm in Java back in 2012, and I only recently ported it to JavaScript. I have a generic UI I use to visualize genetic algorithms/programs I write for the web, but I need to modify it slightly to provide meaningful information on the Brainfuck genetic programmer. It’s also significantly slower than my Java implementation, so it isn’t as able to solve interesting problems in reasonable amounts of time. In the meantime, I’m currently working on a general blog post on genetic algorithms/programming, so stay tuned for that.
Skip to demo Fractals are, in my opinion, the coolest structures in all of math. As if being spectacular to look at weren’t enough, they’re infinitely detailed. Literally. You can zoom as far as you’d like1 into fractals like the Mandelbrot set and always discover more neat patterns. In doing so, however, you’ll notice how each successive layer of detail is reminiscent of the last. That’s because fractals repeat. Self-similarity is their characteristic feature.
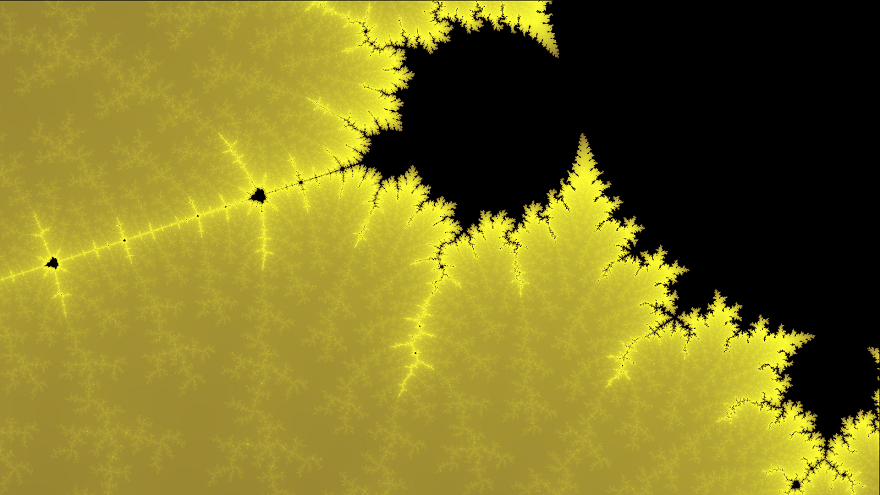
The most famous fractal out there is probably the Mandelbrot set.
Figure 1: This is a zoomed in region of the Mandelbrot set in monochrome yellow.
It is incredibly self similar, as the above image demonstrates. Look at how the bulbs appear to repeat, shrinking and shrinking right to left. The bulbs themselves appear to have limbs, which recur all along their perimeters.
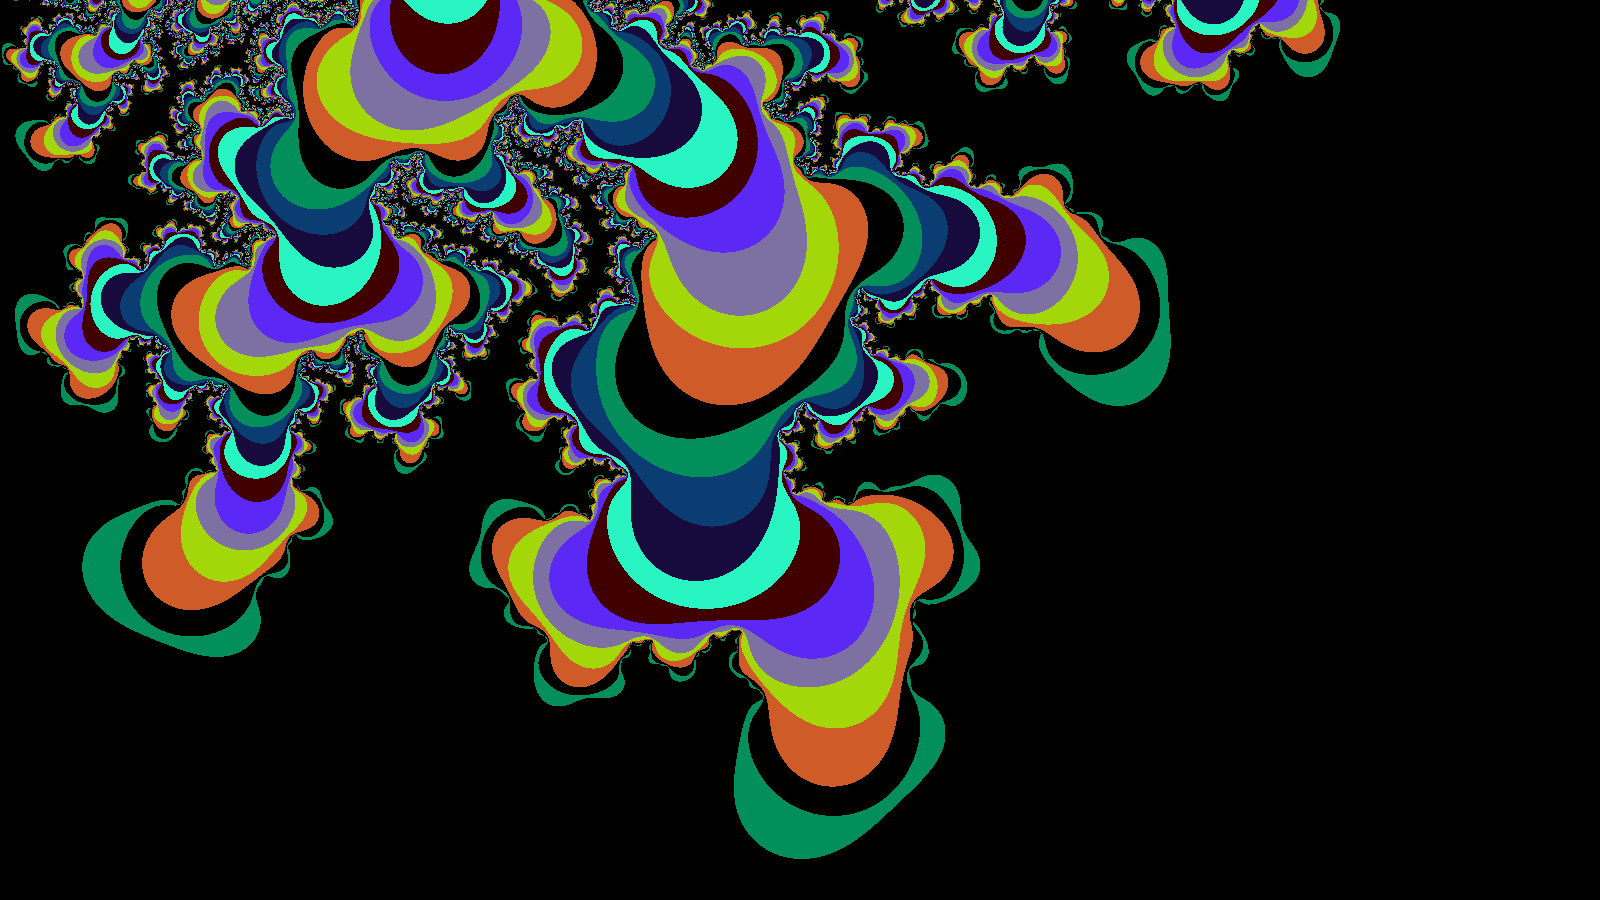
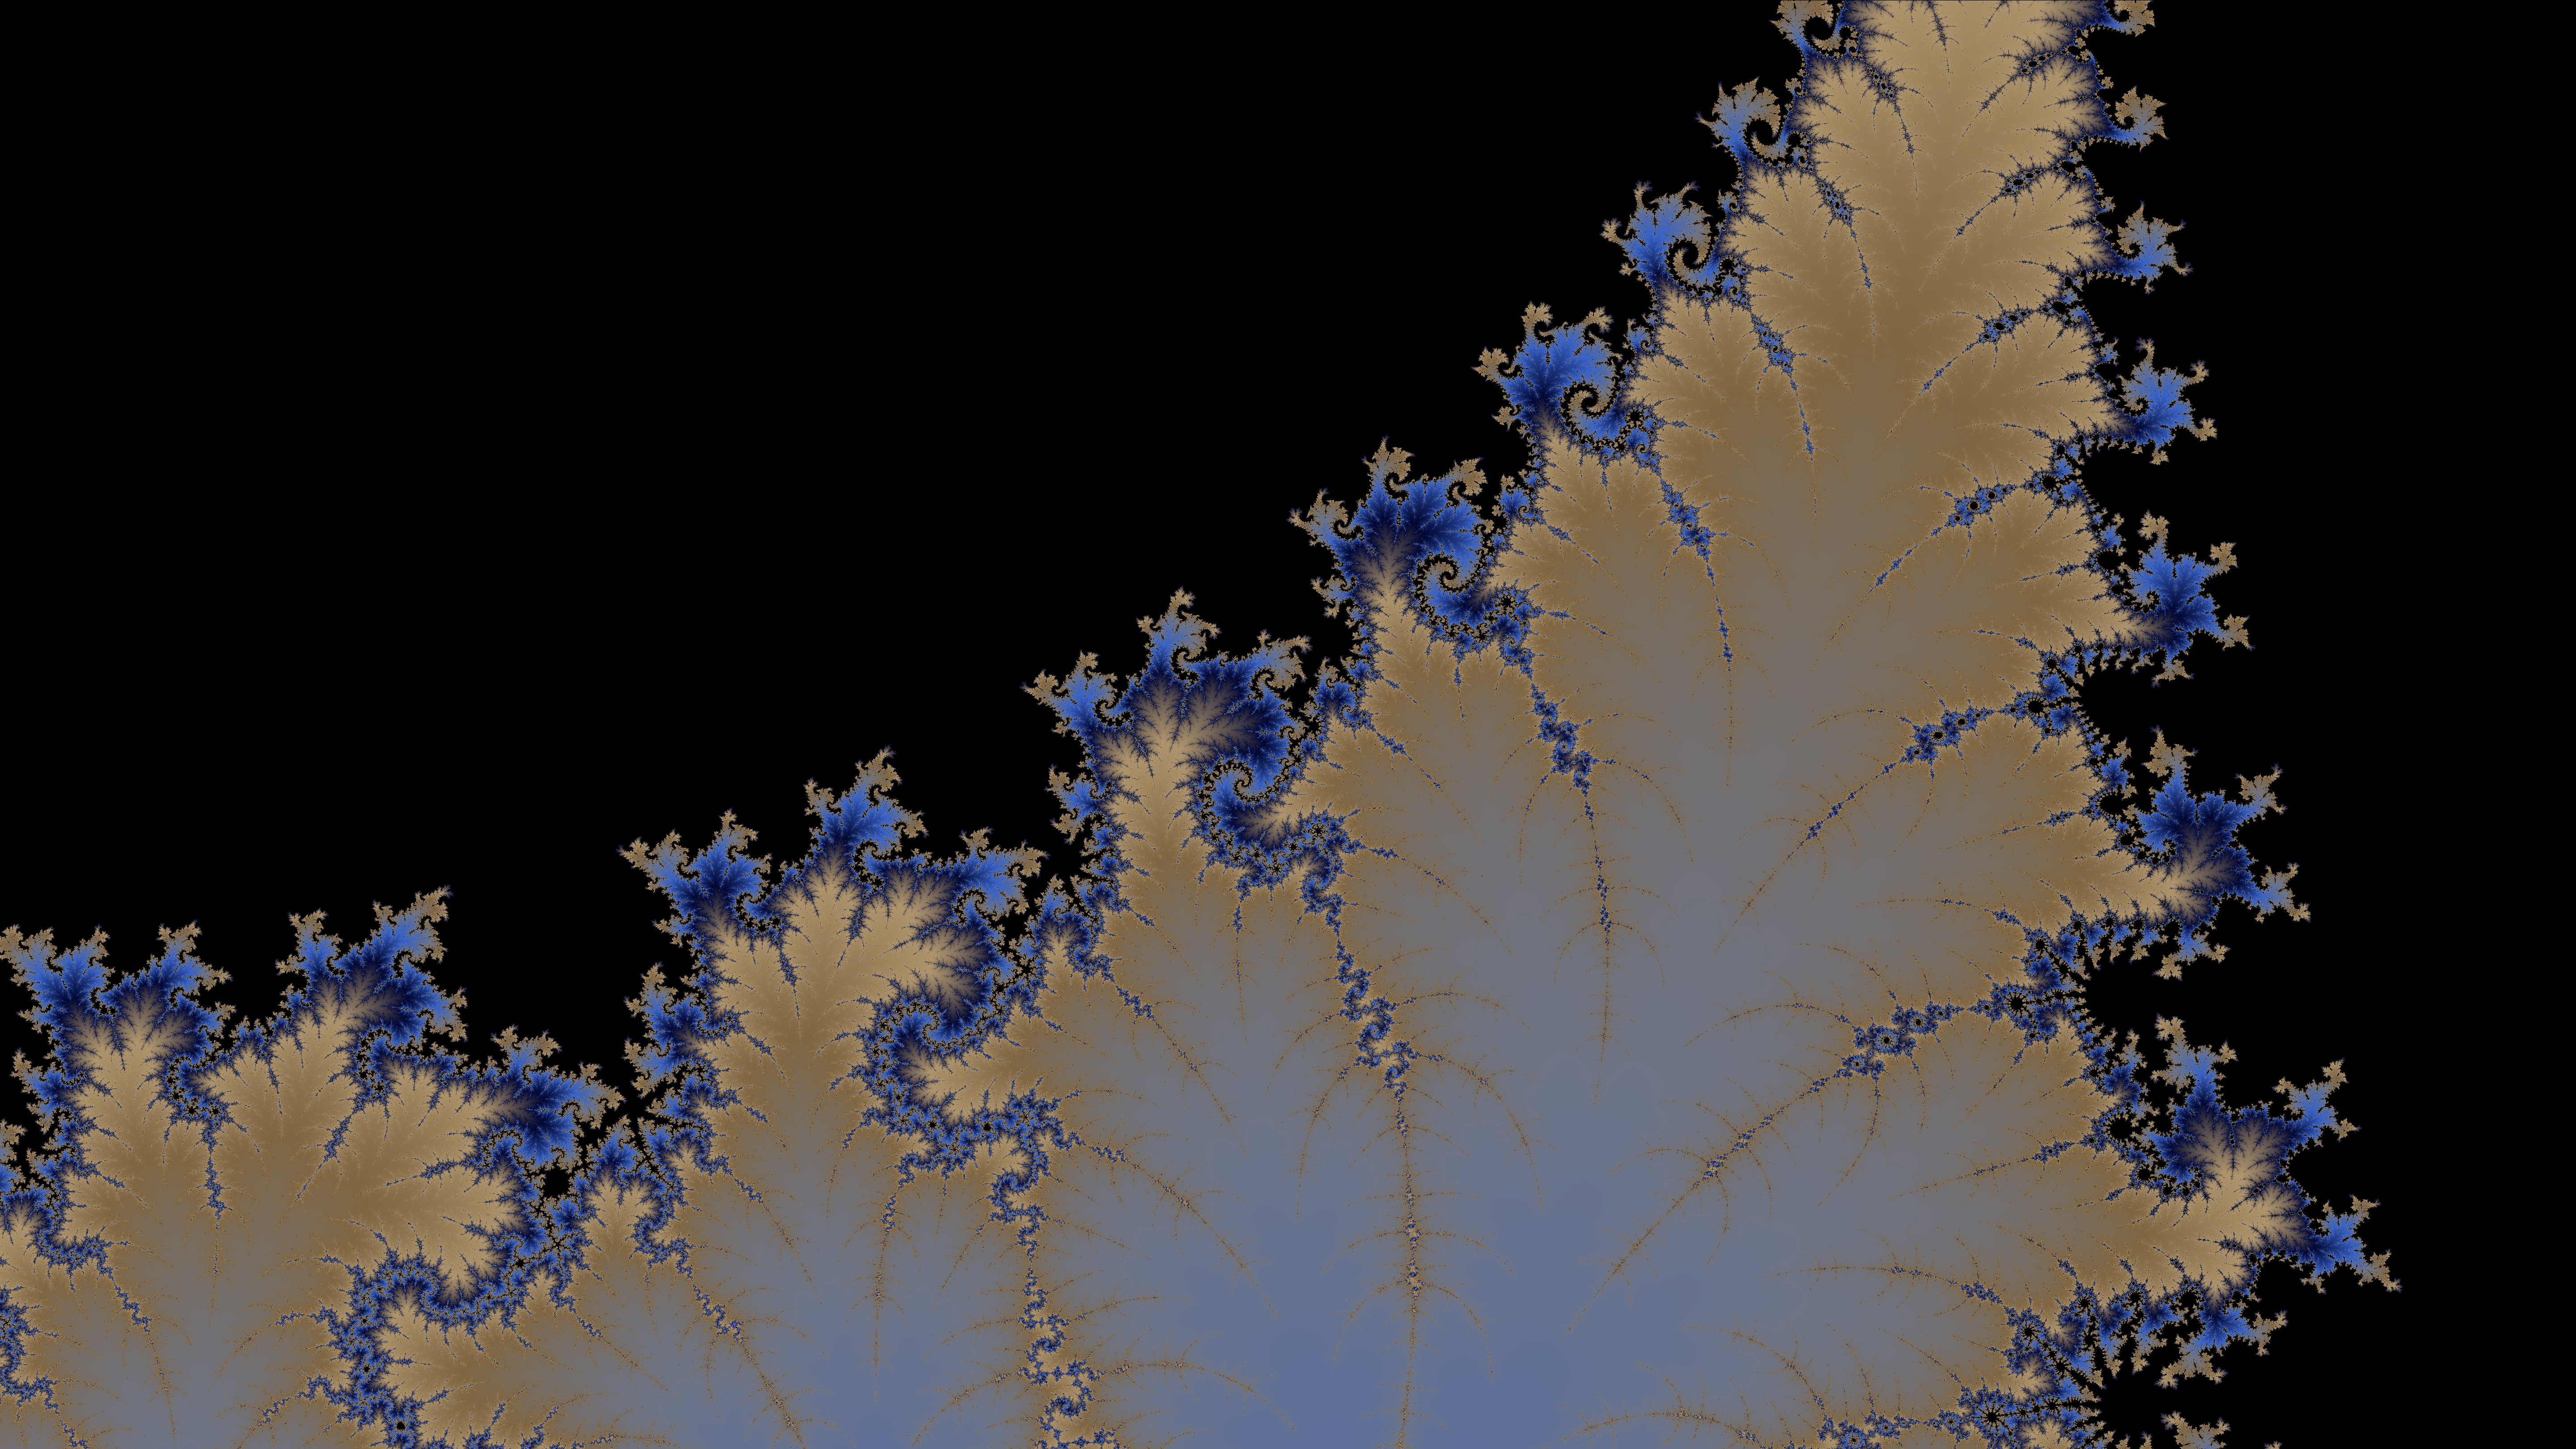
The Burning Ship fractal (BSF) can be thought of as the Mandelbrot set’s sister. As we’ll see later, the equations that describe them are essentially the same. Yet somehow, the fractals themselves appear totally different!
Figure 2: Here’s an image I hunted for in the BSF for valentine’s day. Some post-processing was done to improve the colors and aspect ratio, but the heart shape seen in the image is actually in the fractal!
Unfortunately I didn’t save the coordinates for this image, but I found a few more hearts in the window:
If this is the first you’re hearing about fractals, then you probably think that it’s extremely difficult to draw them. What If I told you that a picture of the Mandelbrot set can be described with the following equation and a few sentences: $$z_{n+1}=z_n^2+c \tag{1}$$
$z$ and $c$ are complex numbers. The real and imaginary parts of $c$ represent each pixel’s x and y-coordinate, respectively. Starting with $z_0=0$, we compute each successive $z$ value as per $(1)$ and observe $z_n$ to see if it spirals out of control. If a certain $c$ value leads to a sequence that doesn’t stop growing, then we color the corresponding pixel white. All other $c$ values correspond to pixels that are in the Mandelbrot set and are consequently colored black.
If you were to take the absolute value of the real and imaginary parts of each $z_n$, you’d get the Burning Ship Fractal’s equation: $$z_{n+1}=(|\operatorname{Re}(z_n)|+i|\operatorname{Im}(z_n)|)^2+c \tag{2}$$
Tips to make your own fractal painter
A natural question is whether or not pixel coordinates can be plugged in as is. The answer is no because the Mandelbrot set occupies a small, $\approx 3\times 2$ unit rectangle in the complex plane. Pixel values have to be mapped to this range.
If you know the dimensions of an image, the coordinates of a pixel can be transformed to a complex number within some window through the use of a map function which takes a number in one range and outputs a number a propotional distance within another range.
/* Given n in [d1, d2], return the corresponding number in [r1, r2]. I encourage you to rewrite this and explain the math on your own. */
function map(n, d1, d2, r1, r2) {
	var Rd = d2-d1;
	var Rr = r2-r1;
	return (Rr/Rd)*(n - d1) + r1;
}

//all the points in this window represent complex numbers
var graphWindow = {
    x_min: -2.5,  x_max: 1, y_min: -1.25, y_max: 1.25
};

var w = 800; //width of the image
var h  = 600; //height
var x = 0; //the pixel's x location, x in [0, w)
var y = 0; //" " y location, y in [0, h)

//the real part of the corresponding complex number
var re = map(x, 0, w, graphWindow.x_min, graphWindow.x_max);
/* Notice the the order of the h and 0; this is due to the fact that image y coordinates increase going down, not going up as in math.*/
var im = map(y, h, 0, graphWindow.y_min, graphWindow.y_max);
I’ll leave it up to you to apply this process to all the pixels in a $w\times h$ image.
Next, you need to know how exactly you determine if a point “spirals out of control”. By that, I mean if the magnitude of $z_n$ tends toward infinity. But how can you possibly know that? What if $|z_{791}|=10^9$ so you say close enough and stop, when $|z_{840}|$ would have settled back down to $30$, where it would have stayed? Well, there’s this property that says that if $|z_n| > 2$, then it will spiral out of control. So all you need to do is see if $z_n$ stays below $2$ for a few hundred generations because if it does, then there’s a good chance it’s in the set.
This is all the information you need to write your own fractal painter, but it’s a lot more fun if you add color. One way to do this is to say, points whose magnitudes exceed $2$ after $20$ iterations are green, after $40$ are red, and after $60$ are orange. Points whose $|z_n|$ stays below $2$ for all tested iterations are assumed to be in the set and are black. This works, but it leads to images with bands of color:
Figure 3: There are $10$ colors in this image. Each point’s maximum iteration is taken $(\bmod\ 10)$ to determine the color.
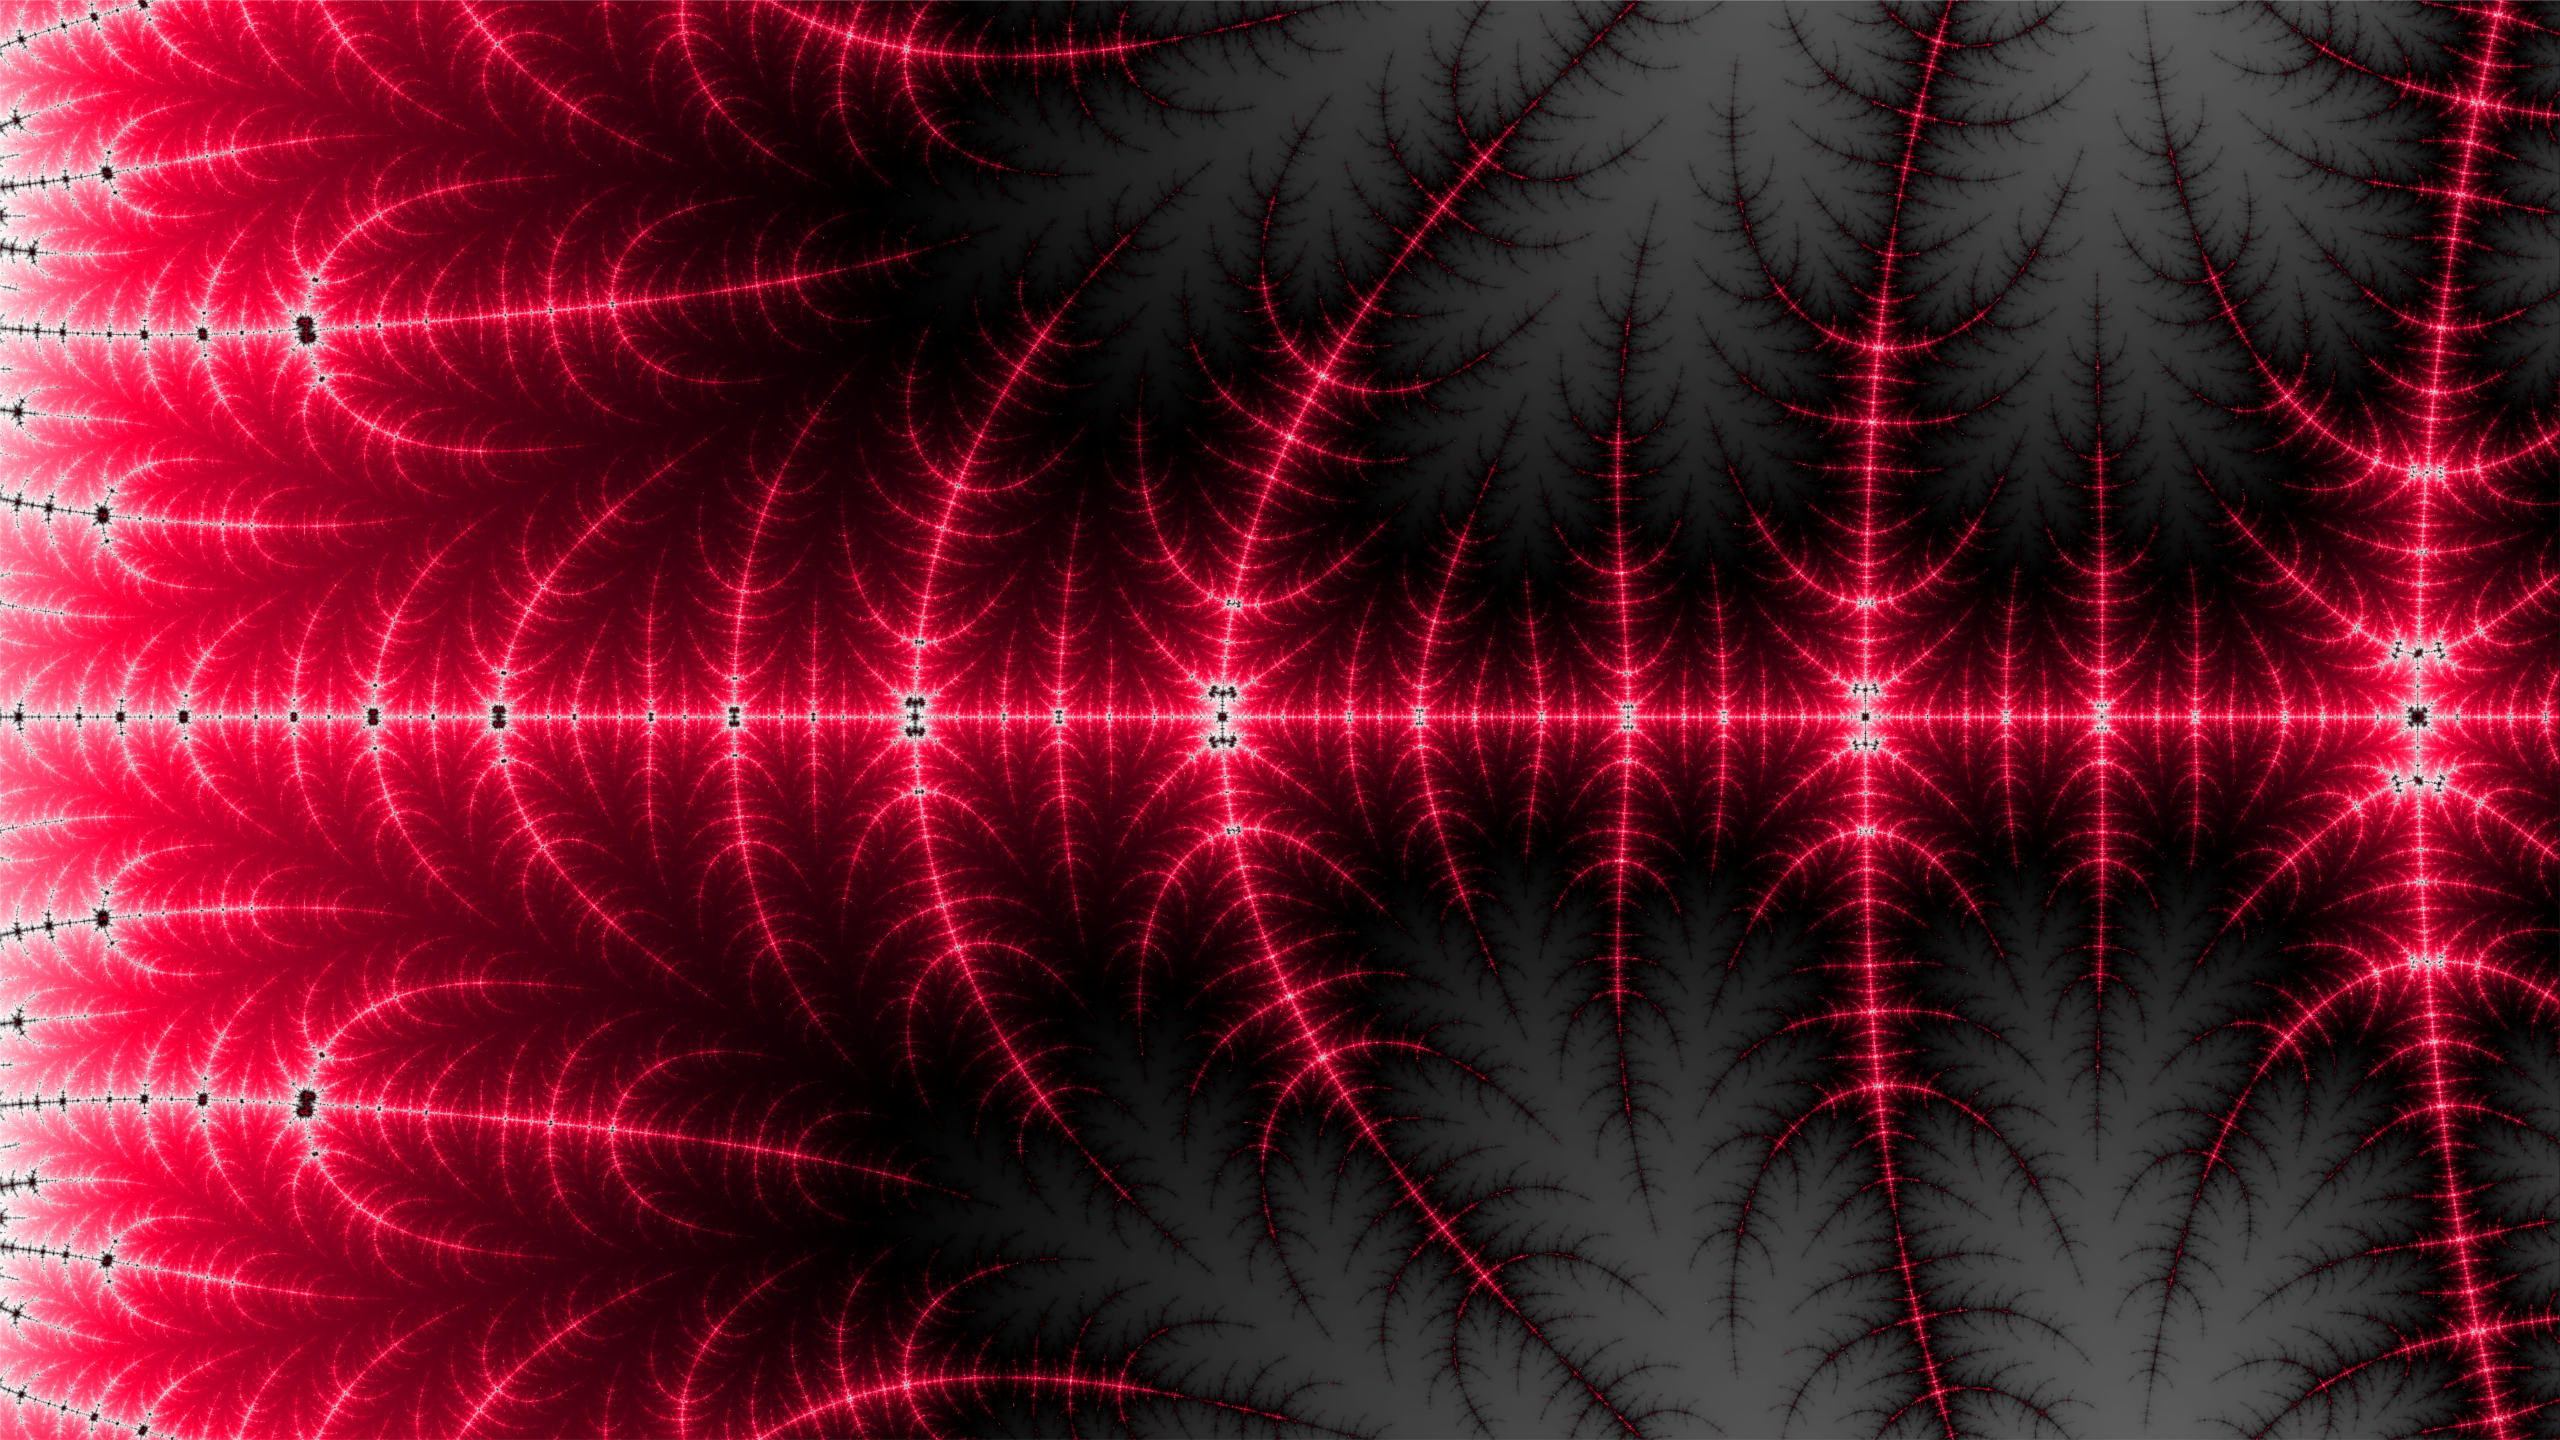
Sometimes this effect is desired, but usually people want to see images that are colored smoothly. You can do this by not only paying attention to how many iterations it takes a point to exceed the magical value of $2$, but also by paying attention to just how much it exceeds $2$ when it does. I’m not going to explain this any further because of all the images I’ve generated, my favorite one resulted from a faulty smooth coloring algorithm.
Figure 4: Notice how the gradients seem to be going in the wrong direction.
I didn’t think much of this picture at the time, so I fixed my algorithm and moved on (I had not yet heard of version control). If you make the same mistake I did and start generating images like these, please send me a message and tell me how you did it!
Fractals in a JS Canvas
Here’s my implementation of a fractal explorer, 100% in Javascript. Scroll with your mouse to zoom in and out. Click and drag to move around. The images don’t generate instantly, so don’t try and do too many things at once. Play around with the settings below and see what they do.
| |
Window size:
Zoom multiplier:
Number of iterations:
Color multiplier:
To blob-save the image, right click and “copy” the image once you’ve pressed the button. Then paste it in some image editor and save that. About the colors: I’ve already made it easy to change the color scheme with Javascript, but I haven’t gotten around to adding that feature to the GUI.
1 While it’s true you can zoom arbitrarily deep into fractals like the Mandlebrot set, in practice the maximum zoom level depends on the strength of your computer and the fractal-viewer that you’re using. This JS implementation is limited by the fact that JS Doubles are 64 bits.
Testing out how easy it is to run javascript in a ghost post. This is a Worley noise function colored with a R->G->B color map and animated by rotating the random nodes around random points.

