HTML5 Fractal Explorer
Skip to demo
Fractals are, in my opinion, the coolest structures in all of math. As if being spectacular to look at weren’t enough, they’re infinitely detailed. Literally. You can zoom as far as you’d like1 into fractals like the Mandelbrot set and always discover more neat patterns. In doing so, however, you’ll notice how each successive layer of detail is reminiscent of the last. That’s because fractals repeat. Self-similarity is their characteristic feature.
The most famous fractal out there is probably the Mandelbrot set.
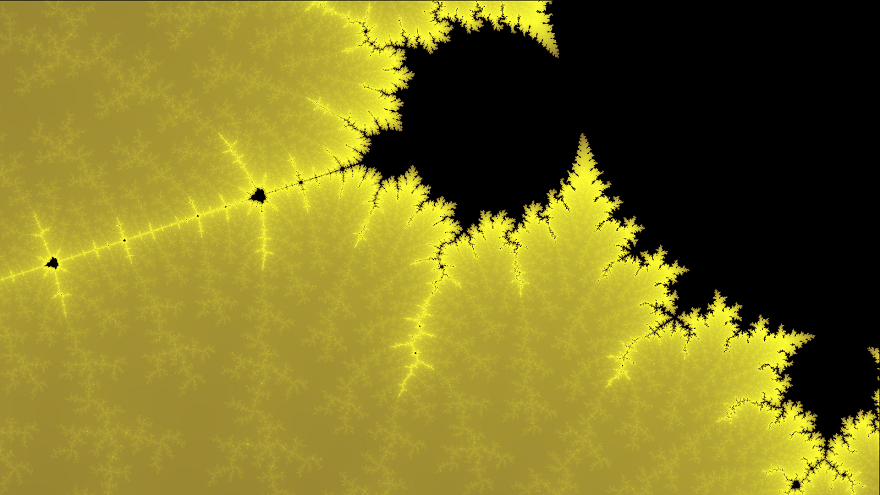
Figure 1: This is a zoomed in region of the Mandelbrot set in monochrome yellow.
It is incredibly self similar, as the above image demonstrates. Look at how the bulbs appear to repeat, shrinking and shrinking right to left. The bulbs themselves appear to have limbs, which recur all along their perimeters.
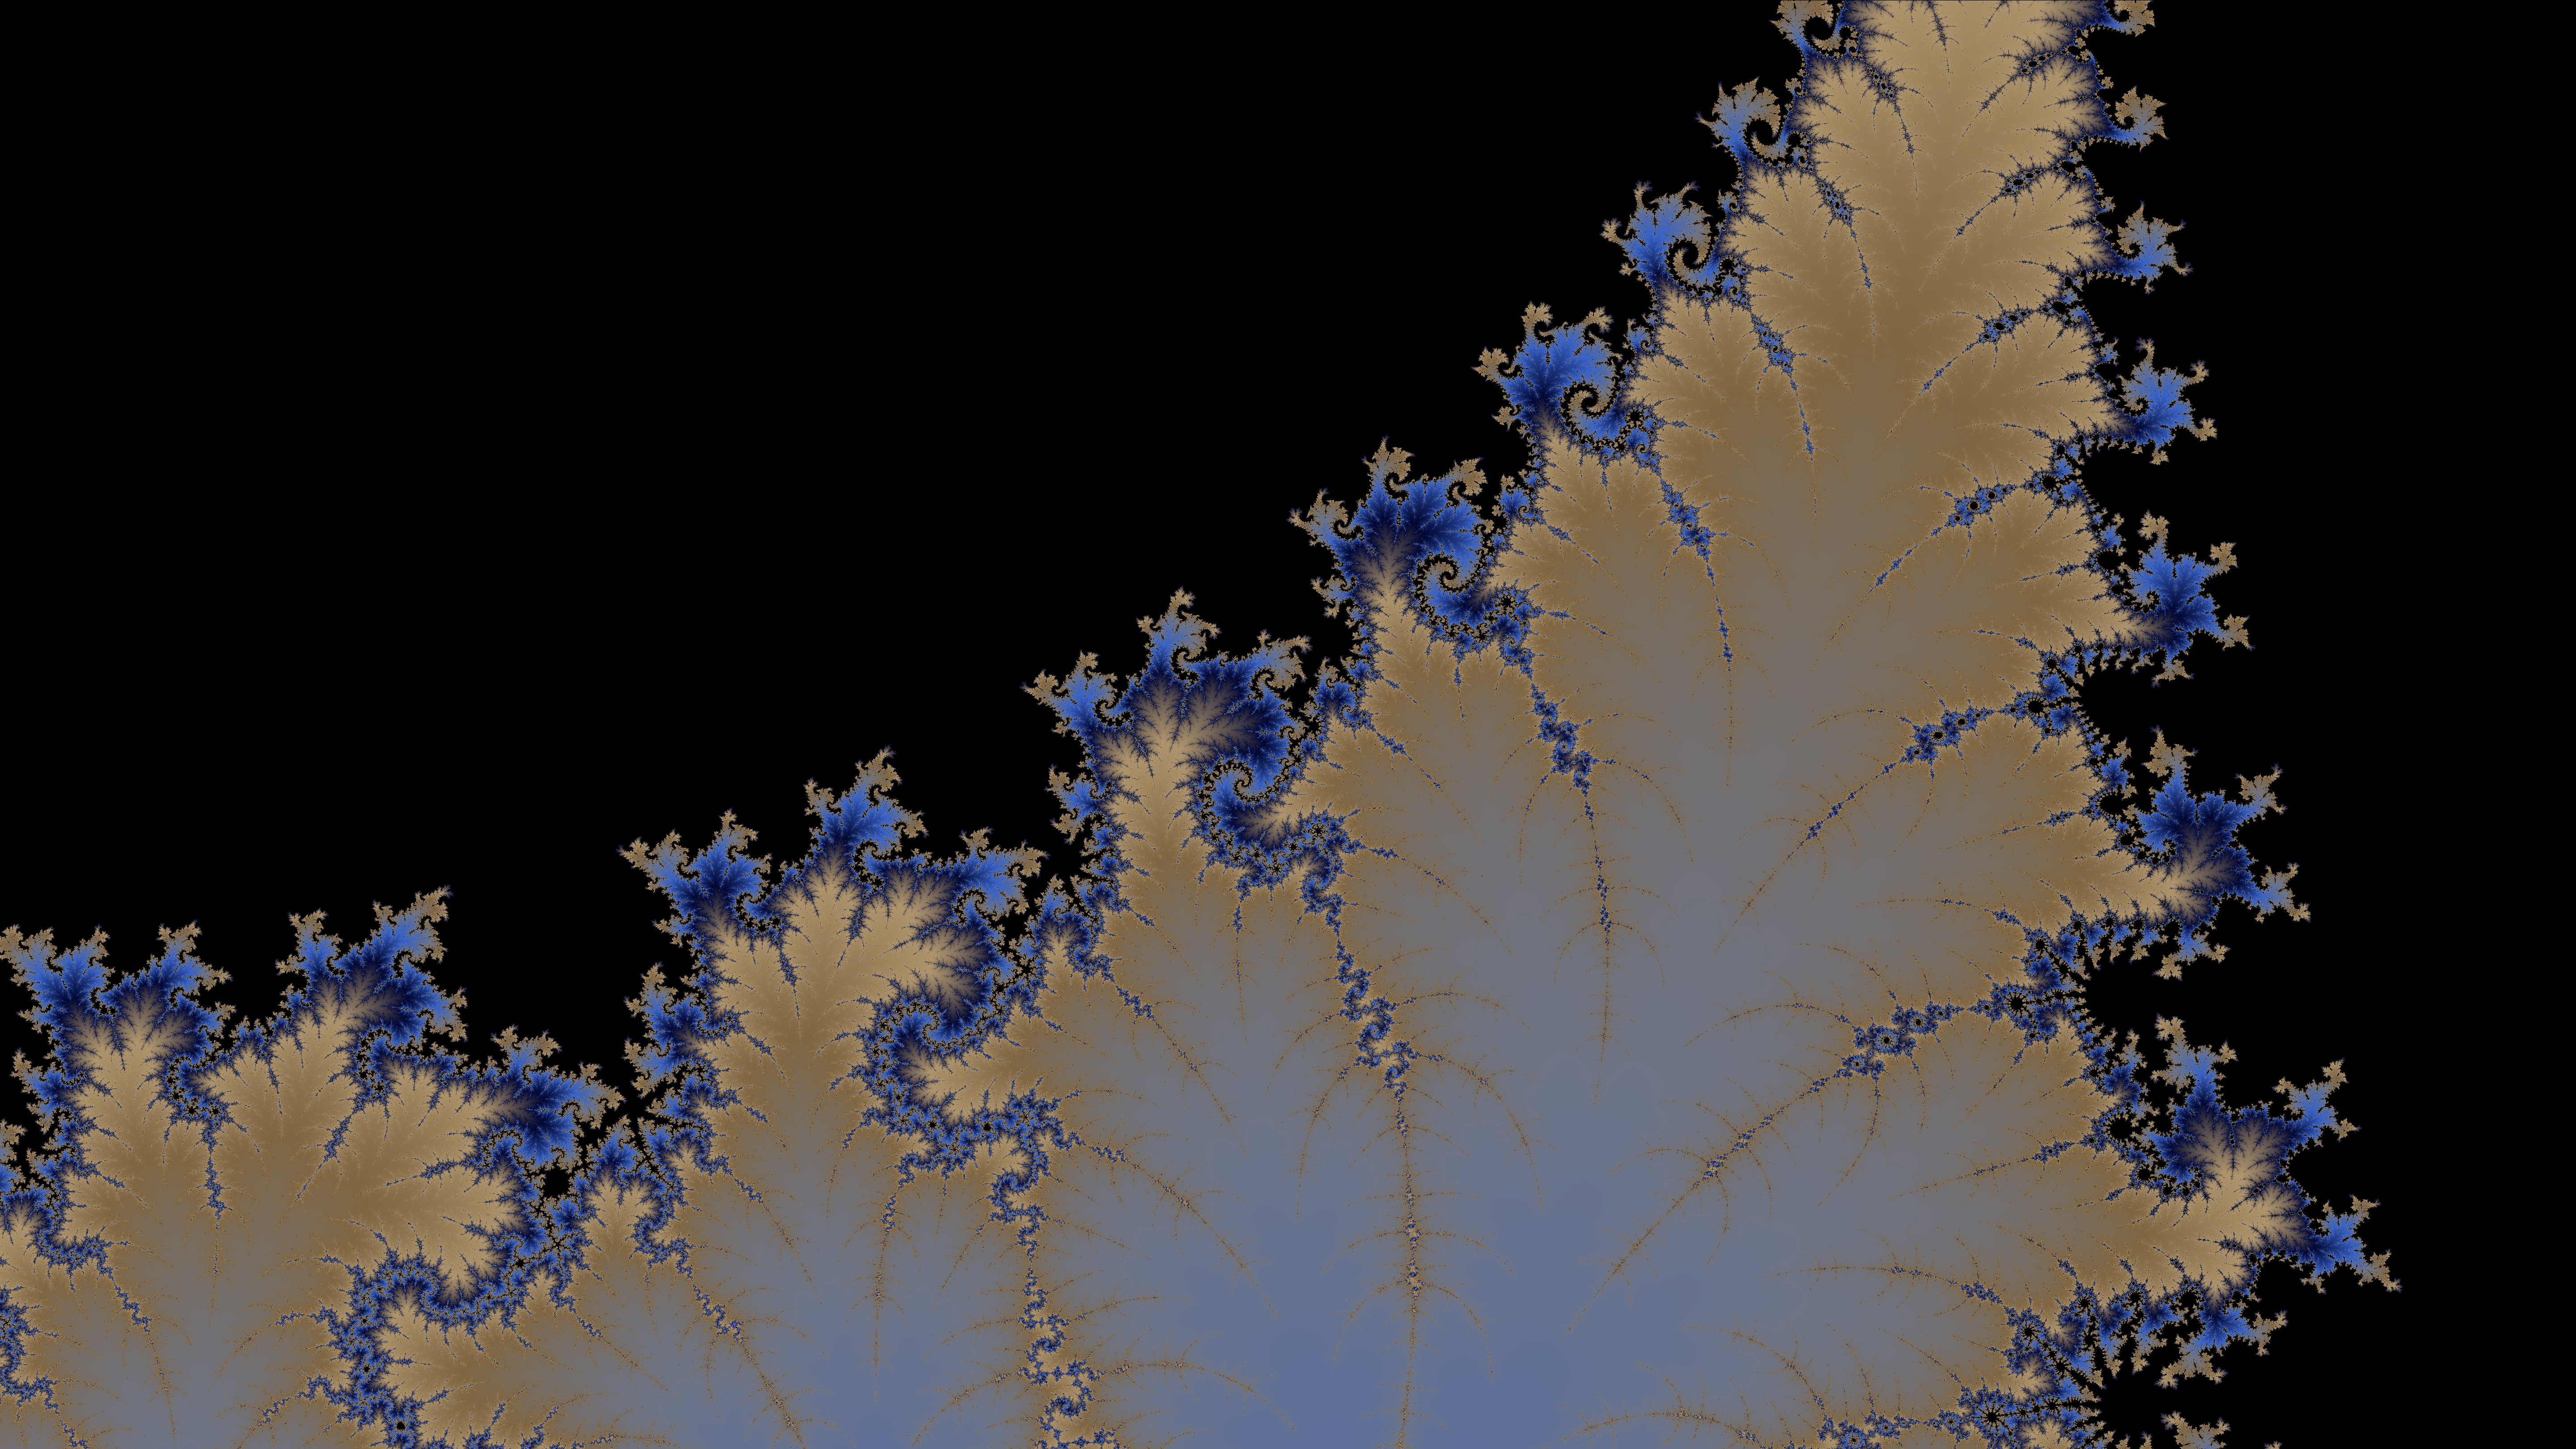
The Burning Ship fractal (BSF) can be thought of as the Mandelbrot set’s sister. As we’ll see later, the equations that describe them are essentially the same. Yet somehow, the fractals themselves appear totally different!

Figure 2: Here’s an image I hunted for in the BSF for valentine’s day. Some post-processing was done to improve the colors and aspect ratio, but the heart shape seen in the image is actually in the fractal!
Unfortunately I didn’t save the coordinates for this image, but I found a few more hearts in the window:1
2
3
4var graphWindow = {x_min: 1.7720029688446448,
x_max: 1.7720029688449772,
y_min: -0.040912002694266925,
y_max: -0.04091200269450447};
Painting Fractals
If this is the first you’re hearing about fractals, then you probably think that it’s extremely difficult to draw them. What If I told you that a picture of the Mandelbrot set can be described with the following equation and a few sentences:
$$z_{n+1}=z_n^2+c \tag{1}$$
$z$ and $c$ are complex numbers. The real and imaginary parts of $c$ represent each pixel’s x and y-coordinate, respectively. Starting with $z_0=0$, we compute each successive $z$ value as per $(1)$ and observe $z_n$ to see if it spirals out of control. If a certain $c$ value leads to a sequence that doesn’t stop growing, then we color the corresponding pixel white. All other $c$ values correspond to pixels that are in the Mandelbrot set and are consequently colored black.
If you were to take the absolute value of the real and imaginary parts of each $z_n$, you’d get the Burning Ship Fractal’s equation:
$$z_{n+1}=(|\operatorname{Re}(z_n)|+i|\operatorname{Im}(z_n)|)^2+c \tag{2}$$
Tips to make your own fractal painter
A natural question is whether or not pixel coordinates can be plugged in as is. The answer is no because the Mandelbrot set occupies a small, $\approx 3\times 2$ unit rectangle in the complex plane. Pixel values have to be mapped to this range.
If you know the dimensions of an image, the coordinates of a pixel can be transformed to a complex number within some window through the use of a map function which takes a number in one range and outputs a number a propotional distance within another range.
1 | /* Given n in [d1, d2], return the corresponding number in [r1, r2]. I encourage you to rewrite this and explain the math on your own. */ |
I’ll leave it up to you to apply this process to all the pixels in a $w\times h$ image.
Next, you need to know how exactly you determine if a point “spirals out of control”. By that, I mean if the magnitude of $z_n$ tends toward infinity. But how can you possibly know that? What if $|z_{791}|=10^9$ so you say close enough and stop, when $|z_{840}|$ would have settled back down to $30$, where it would have stayed? Well, there’s this property that says that if $|z_n| > 2$, then it will spiral out of control. So all you need to do is see if $z_n$ stays below $2$ for a few hundred generations because if it does, then there’s a good chance it’s in the set.
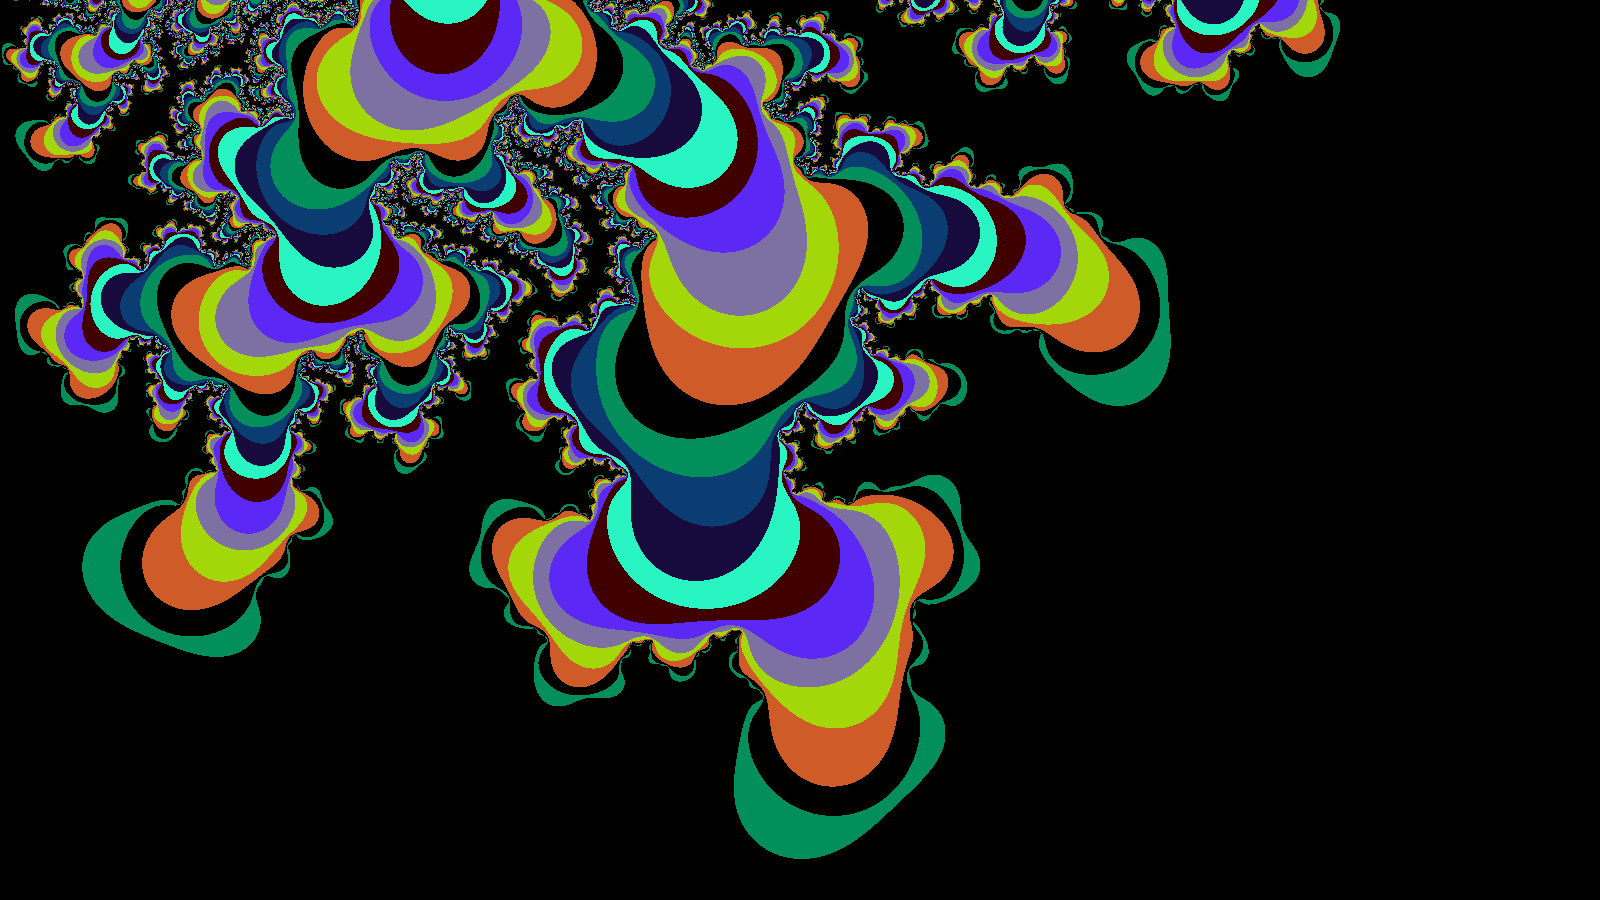
This is all the information you need to write your own fractal painter, but it’s a lot more fun if you add color. One way to do this is to say, points whose magnitudes exceed $2$ after $20$ iterations are green, after $40$ are red, and after $60$ are orange. Points whose $|z_n|$ stays below $2$ for all tested iterations are assumed to be in the set and are black. This works, but it leads to images with bands of color:

Figure 3: There are $10$ colors in this image. Each point’s maximum iteration is taken $(\bmod\ 10)$ to determine the color.
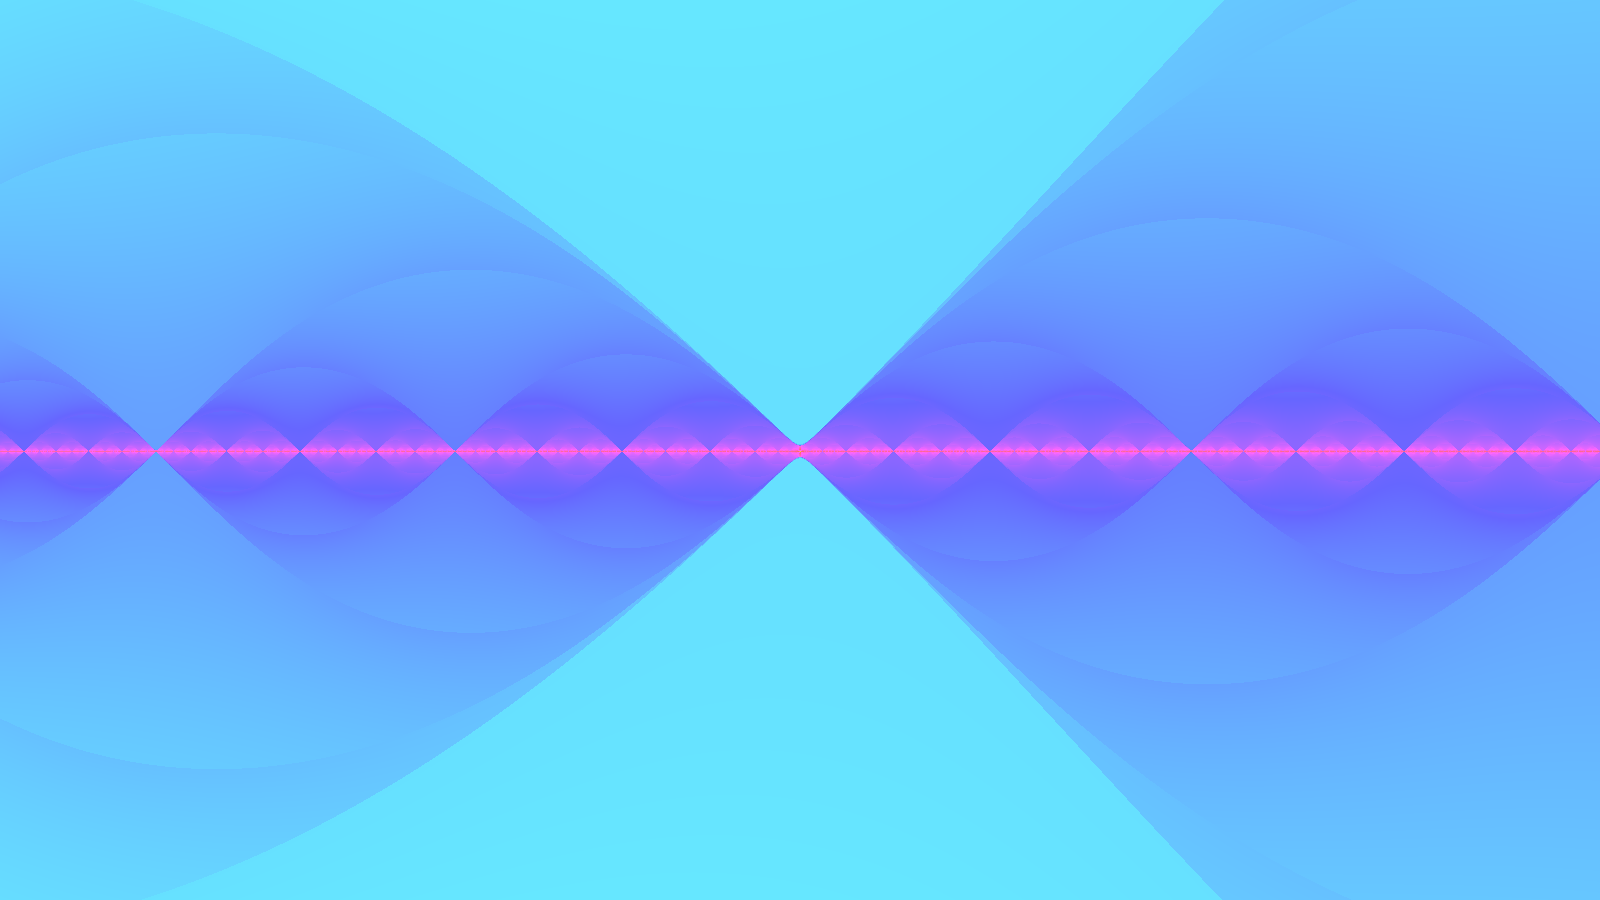
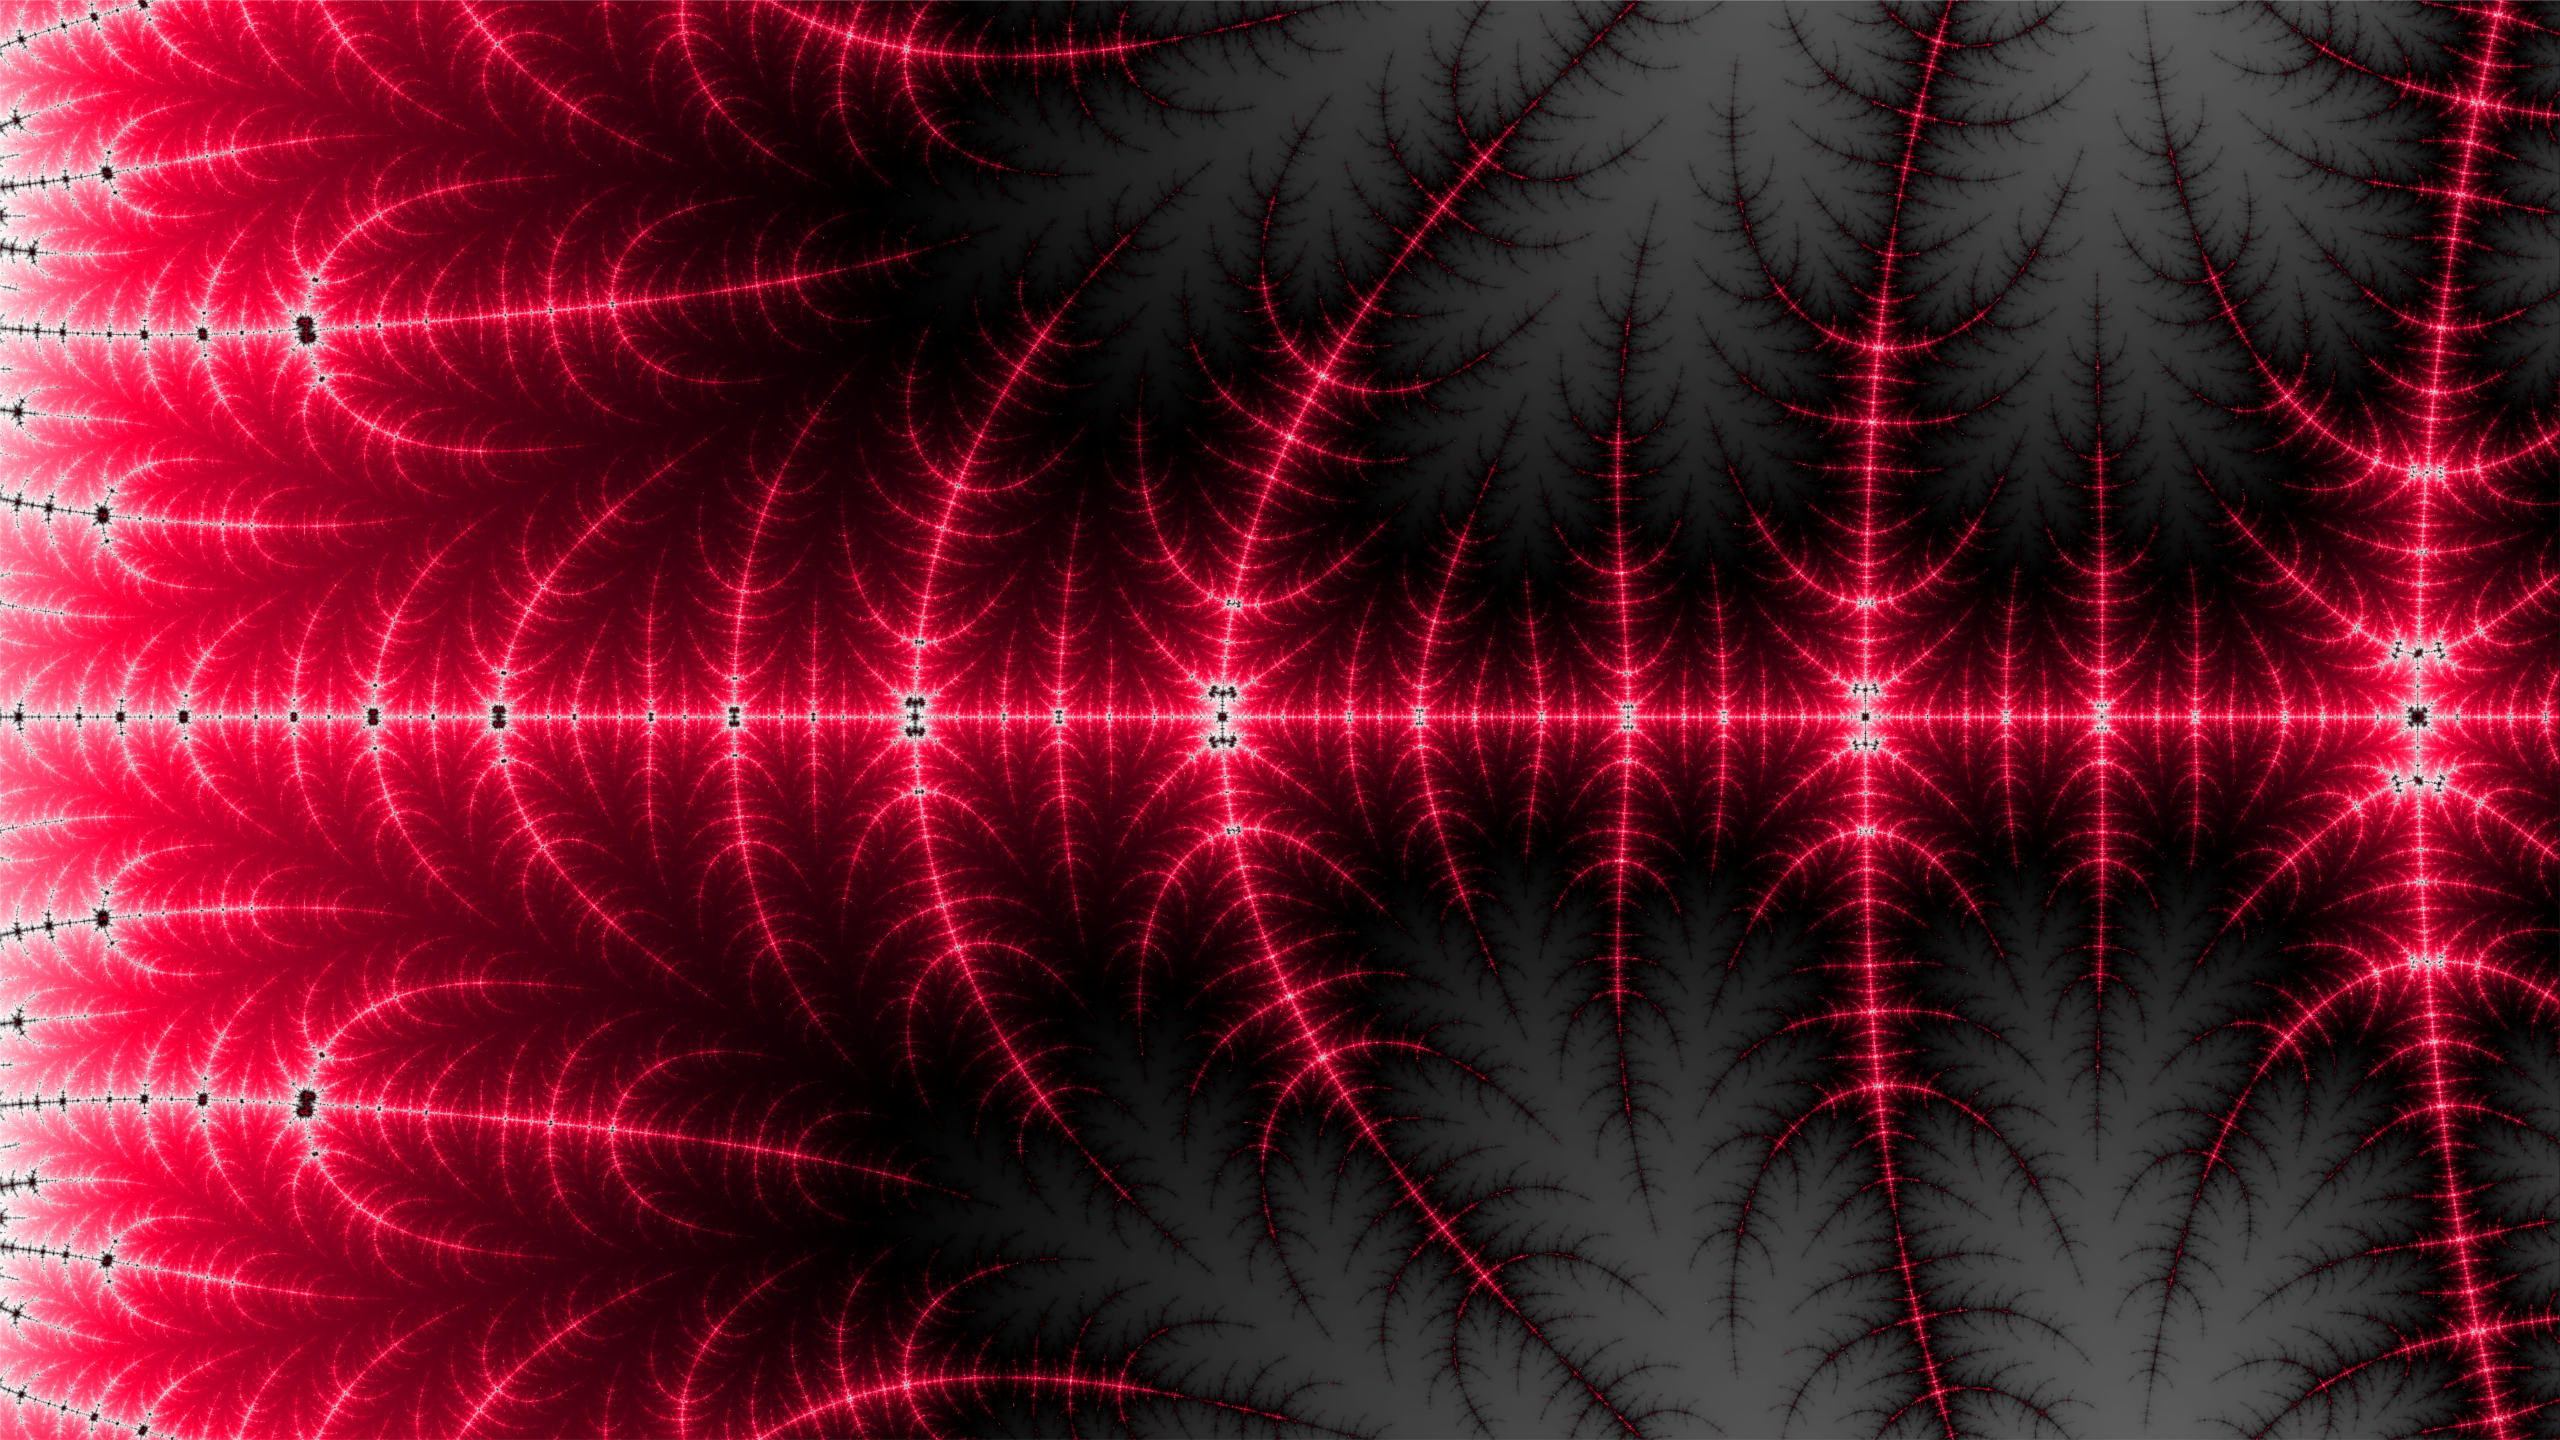
Sometimes this effect is desired, but usually people want to see images that are colored smoothly. You can do this by not only paying attention to how many iterations it takes a point to exceed the magical value of $2$, but also by paying attention to just how much it exceeds $2$ when it does. I’m not going to explain this any further because of all the images I’ve generated, my favorite one resulted from a faulty smooth coloring algorithm.
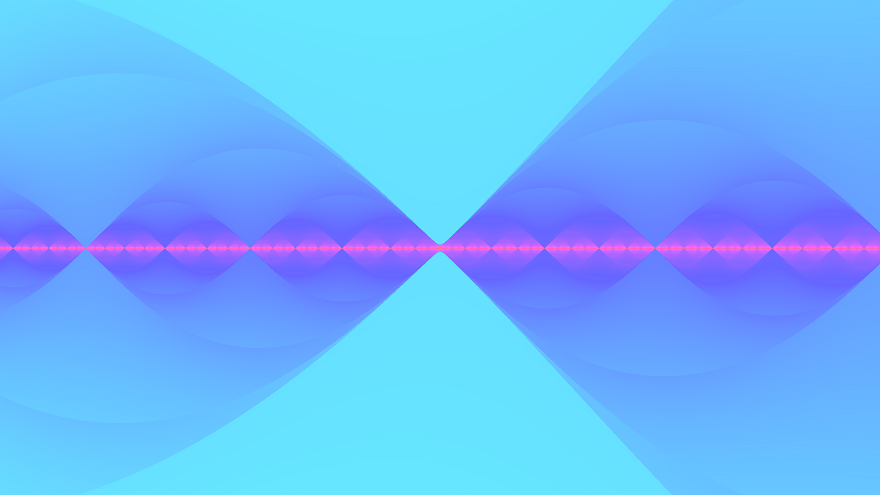
Figure 4: Notice how the gradients seem to be going in the wrong direction.
I didn’t think much of this picture at the time, so I fixed my algorithm and moved on (I had not yet heard of version control). If you make the same mistake I did and start generating images like these, please send me a message and tell me how you did it!
Fractals in a JS Canvas
Here’s my implementation of a fractal explorer, 100% in Javascript. Scroll with your mouse to zoom in and out. Click and drag to move around. The images don’t generate instantly, so don’t try and do too many things at once. Play around with the settings below and see what they do.
|
|
Window size:
Zoom multiplier:
Number of iterations:
Color multiplier:
To blob-save the image, right click and “copy” the image once you’ve pressed the button. Then paste it in some image editor and save that. About the colors: I’ve already made it easy to change the color scheme with Javascript, but I haven’t gotten around to adding that feature to the GUI.
### Gallery
Footnotes
1 While it’s true you can zoom arbitrarily deep into fractals like the Mandlebrot set, in practice the maximum zoom level depends on the strength of your computer and the fractal-viewer that you’re using. This JS implementation is limited by the fact that JS Doubles are 64 bits.